Strategy Chameleon [theUltimator5]Have you ever looked at an indicator and wondered to yourself "Is this indicator actually profitable?" Well now you can test it out for yourself with the Strategy Chameleon!
Strategy Chameleon is a versatile, signal-agnostic trading strategy designed to adapt to any external indicator or trading system. Like a chameleon changes colors to match its environment, this strategy adapts to match any buy/sell signals you provide, making it the ultimate backtesting and automation tool for traders who want to test multiple strategies without rewriting code.
🎯 Key Features
1) Connects ANY external indicator's buy/sell signals
Works with RSI, MACD, moving averages, custom indicators, or any Pine Script output
Simply connect your indicator's signal output to the strategy inputs
2) Multiple Stop Loss Types:
Percentage-based stops
ATR (Average True Range) dynamic stops
Fixed point stops
3) Advanced Trailing Stop System:
Percentage trailing
ATR-based trailing
Fixed point trailing
4) Flexible Take Profit Options:
Risk:Reward ratio targeting
Percentage-based profits
ATR-based profits
Fixed point profits
5) Trading Direction Control
Long Only - Bull market strategies
Short Only - Bear market strategies
Both - Full market strategies
6) Time-Based Filtering
Optional trading session restrictions
Customize active trading hours
Perfect for day trading strategies
📈 How It Works
Signal Detection: The strategy monitors your connected buy/sell signals
Entry Logic: Executes trades when signals trigger during valid time periods
Risk Management: Automatically applies your chosen stop loss and take profit levels
Trailing System: Dynamically adjusts stops to lock in profits
Performance Tracking: Real-time statistics table showing win rate and performance
⚙️ Setup Instructions
0) Add indicator you want to test, then add the Strategy to your chart
Connect Your Signals:
imgur.com
Go to strategy settings → Signal Sources
1) Set "Buy Signal Source" to your indicator's buy output
2) Set "Sell Signal Source" to your indicator's sell output
3) Choose table position - This simply changes the table location on the screen
4) Set trading direction preference - Buy only? Sell only? Both directions?
imgur.com
5) Set your preferred stop loss type and level
You can set the stop loss to be either percentage based or ATR and fully configurable.
6) Enable trailing stops if desired
imgur.com
7) Configure take profit settings
8) Toggle time filter to only consider specific time windows or trading sessions.
🚀 Use Cases
Test various indicators to determine feasibility and/or profitability.
Compare different signal sources quickly
Validate trading ideas with consistent risk management
Portfolio Management
Apply uniform risk management across different strategies
Standardize stop loss and take profit rules
Monitor performance consistently
Automation Ready
Built-in alert conditions for automated trading
Compatible with trading bots and webhooks
Easy integration with external systems
⚠️ Important Notes
This strategy requires external signals to function
Default settings use 10% of equity per trade
Pyramiding is disabled (one position at a time)
Strategy calculates on bar close, not every tick
🔗 Integration Examples
Works perfectly with:
RSI strategies (connect RSI > 70 for sells, RSI < 30 for buys)
Moving average crossovers
MACD signal line crosses
Bollinger Band strategies
Custom oscillators and indicators
Multi-timeframe strategies
📋 Default Settings
Position Size: 10% of equity
Stop Loss: 2% percentage-based
Trailing Stop: 1.5% percentage-based (enabled)
Take Profit: Disabled (optional)
Trade Direction: Both long and short
Time Filter: Disabled
스크립트에서 "Automated Trading"에 대해 찾기

MACD Liquidity Tracker Strategy [Quant Trading]MACD Liquidity Tracker Strategy
Overview
The MACD Liquidity Tracker Strategy is an enhanced trading system that transforms the traditional MACD indicator into a comprehensive momentum-based strategy with advanced visual signals and risk management. This strategy builds upon the original MACD Liquidity Tracker System indicator by TheNeWSystemLqtyTrckr , converting it into a fully automated trading strategy with improved parameters and additional features.
What Makes This Strategy Original
This strategy significantly enhances the basic MACD approach by introducing:
Four distinct system types for different market conditions and trading styles
Advanced color-coded histogram visualization with four dynamic colors showing momentum strength and direction
Integrated trend filtering using 9 different moving average types
Comprehensive risk management with customizable stop-loss and take-profit levels
Multiple alert systems for entry signals, exits, and trend conditions
Flexible signal display options with customizable entry markers
How It Works
Core MACD Calculation
The strategy uses a fully customizable MACD configuration with traditional default parameters:
Fast MA : 12 periods (customizable, minimum 1, no maximum limit)
Slow MA : 26 periods (customizable, minimum 1, no maximum limit)
Signal Line : 9 periods (customizable, now properly implemented and used)
Cryptocurrency Optimization : The strategy's flexible parameter system allows for significant optimization across different crypto assets. Traditional MACD settings (12/26/9) often generate excessive noise and false signals in volatile crypto markets. By using slower, more smoothed parameters, traders can capture meaningful momentum shifts while filtering out market noise.
Example - DOGE Optimization (45/80/290 settings) :
• Performance : Optimized parameters yielding exceptional backtesting results with 29,800% PnL
• Why it works : DOGE's high volatility and social sentiment-driven price action benefits from heavily smoothed indicators
• Timeframes : Particularly effective on 30-minute and 4-hour charts for swing trading
• Logic : The very slow parameters filter out noise and capture only the most significant trend changes
Other Optimizable Cryptocurrencies : This parameter flexibility makes the strategy highly effective for major altcoins including SUI, SEI, LINK, Solana (SOL) , and many others. Each crypto asset can benefit from custom parameter tuning based on its unique volatility profile and trading characteristics.
Four Trading System Types
1. Normal System (Default)
Long signals : When MACD line is above the signal line
Short signals : When MACD line is below the signal line
Best for : Swing trading and capturing longer-term trends in stable markets
Logic : Traditional MACD crossover approach using the signal line
2. Fast System
Long signals : Bright Blue OR Dark Magenta (transparent) histogram colors
Short signals : Dark Blue (transparent) OR Bright Magenta histogram colors
Best for : Scalping and high-volatility markets (crypto, forex)
Logic : Leverages early momentum shifts based on histogram color changes
3. Safe System
Long signals : Only Bright Blue histogram color (strongest bullish momentum)
Short signals : All other colors (Dark Blue, Bright Magenta, Dark Magenta)
Best for : Risk-averse traders and choppy markets
Logic : Prioritizes only the strongest bullish signals while treating everything else as bearish
4. Crossover System
Long signals : MACD line crosses above signal line
Short signals : MACD line crosses below signal line
Best for : Precise timing entries with traditional MACD methodology
Logic : Pure crossover signals for more precise entry timing
Color-Coded Histogram Logic
The strategy uses four distinct colors to visualize momentum:
🔹 Bright Blue : MACD > 0 and rising (strong bullish momentum)
🔹 Dark Blue (Transparent) : MACD > 0 but falling (weakening bullish momentum)
🔹 Bright Magenta : MACD < 0 and falling (strong bearish momentum)
🔹 Dark Magenta (Transparent) : MACD < 0 but rising (weakening bearish momentum)
Trend Filter Integration
The strategy includes an advanced trend filter using 9 different moving average types:
SMA (Simple Moving Average)
EMA (Exponential Moving Average) - Default
WMA (Weighted Moving Average)
HMA (Hull Moving Average)
RMA (Running Moving Average)
LSMA (Least Squares Moving Average)
DEMA (Double Exponential Moving Average)
TEMA (Triple Exponential Moving Average)
VIDYA (Variable Index Dynamic Average)
Default Settings : 50-period EMA for trend identification
Visual Signal System
Entry Markers : Blue triangles (▲) below candles for long entries, Magenta triangles (▼) above candles for short entries
Candle Coloring : Price candles change color based on active signals (Blue = Long, Magenta = Short)
Signal Text : Optional "Long" or "Short" text inside entry triangles (toggleable)
Trend MA : Gray line plotted on main chart for trend reference
Parameter Optimization Examples
DOGE Trading Success (Optimized Parameters) :
Using 45/80/290 MACD settings with 50-period EMA trend filter has shown exceptional results on DOGE:
Performance : Backtesting results showing 29,800% PnL demonstrate the power of proper parameter optimization
Reasoning : DOGE's meme-driven volatility and social sentiment spikes create significant noise with traditional MACD settings
Solution : Very slow parameters (45/80/290) filter out social media-driven price spikes while capturing only major momentum shifts
Optimal Timeframes : 30-minute and 4-hour charts for swing trading opportunities
Result : Exceptionally clean signals with minimal false entries during DOGE's characteristic pump-and-dump cycles
Multi-Crypto Adaptability :
The same optimization principles apply to other major cryptocurrencies:
SUI : Benefits from smoothed parameters due to newer coin volatility patterns
SEI : Requires adjustment for its unique DeFi-related price movements
LINK : Oracle news events create price spikes that benefit from noise filtering
Solana (SOL) : Network congestion events and ecosystem developments need smoothed detection
General Rule : Higher volatility coins typically benefit from very slow MACD parameters (40-50 / 70-90 / 250-300 ranges)
Key Input Parameters
System Type : Choose between Fast, Normal, Safe, or Crossover (Default: Normal)
MACD Fast MA : 12 periods default (no maximum limit, consider 40-50 for crypto optimization)
MACD Slow MA : 26 periods default (no maximum limit, consider 70-90 for crypto optimization)
MACD Signal MA : 9 periods default (now properly utilized, consider 250-300 for crypto optimization)
Trend MA Type : EMA default (9 options available)
Trend MA Length : 50 periods default (no maximum limit)
Signal Display : Both, Long Only, Short Only, or None
Show Signal Text : True/False toggle for entry marker text
Trading Applications
Recommended Use Cases
Momentum Trading : Capitalize on strong directional moves using the color-coded system
Trend Following : Combine MACD signals with trend MA filter for higher probability trades
Scalping : Use "Fast" system type for quick entries in volatile markets
Swing Trading : Use "Normal" or "Safe" system types for longer-term positions
Cryptocurrency Trading : Optimize parameters for individual crypto assets (e.g., 45/80/290 for DOGE, custom settings for SUI, SEI, LINK, SOL)
Market Suitability
Volatile Markets : Forex, crypto, indices (recommend "Fast" system or smoothed parameters)
Stable Markets : Stocks, ETFs (recommend "Normal" or "Safe" system)
All Timeframes : Effective from 1-minute charts to daily charts
Crypto Optimization : Each major cryptocurrency (DOGE, SUI, SEI, LINK, SOL, etc.) can benefit from custom parameter tuning. Consider slower MACD parameters for noise reduction in volatile crypto markets
Alert System
The strategy provides comprehensive alerts for:
Entry Signals : Long and short entry triangle appearances
Exit Signals : Position exit notifications
Color Changes : Individual histogram color alerts
Trend Conditions : Price above/below trend MA alerts
Strategy Parameters
Default Settings
Initial Capital : $1,000
Position Size : 100% of equity
Commission : 0.1%
Slippage : 3 points
Date Range : January 1, 2018 to December 31, 2069
Risk Management (Optional)
Stop Loss : Disabled by default (customizable percentage-based)
Take Profit : Disabled by default (customizable percentage-based)
Short Trades : Disabled by default (can be enabled)
Important Notes and Limitations
Backtesting Considerations
Uses realistic commission (0.1%) and slippage (3 points)
Default position sizing uses 100% equity - adjust based on risk tolerance
Stop-loss and take-profit are disabled by default to show raw strategy performance
Strategy does not use lookahead bias or future data
Risk Warnings
Past performance does not guarantee future results
MACD-based strategies may produce false signals in ranging markets
Consider combining with additional confluences like support/resistance levels
Test thoroughly on demo accounts before live trading
Adjust position sizing based on your risk management requirements
Technical Limitations
Strategy does not work on non-standard chart types (Heikin Ashi, Renko, etc.)
Signals are based on close prices and may not reflect intraday price action
Multiple rapid signals in volatile conditions may result in overtrading
Credits and Attribution
This strategy is based on the original "MACD Liquidity Tracker System" indicator created by TheNeWSystemLqtyTrckr . This strategy version includes significant enhancements:
Complete strategy implementation with entry/exit logic
Addition of the "Crossover" system type
Proper implementation and utilization of the MACD signal line
Enhanced risk management features
Improved parameter flexibility with no artificial maximum limits
Additional alert systems for comprehensive trade management
The original indicator's core color logic and visual system have been preserved while expanding functionality for automated trading applications.

MA Signal IndicatorMA Signal Indicator
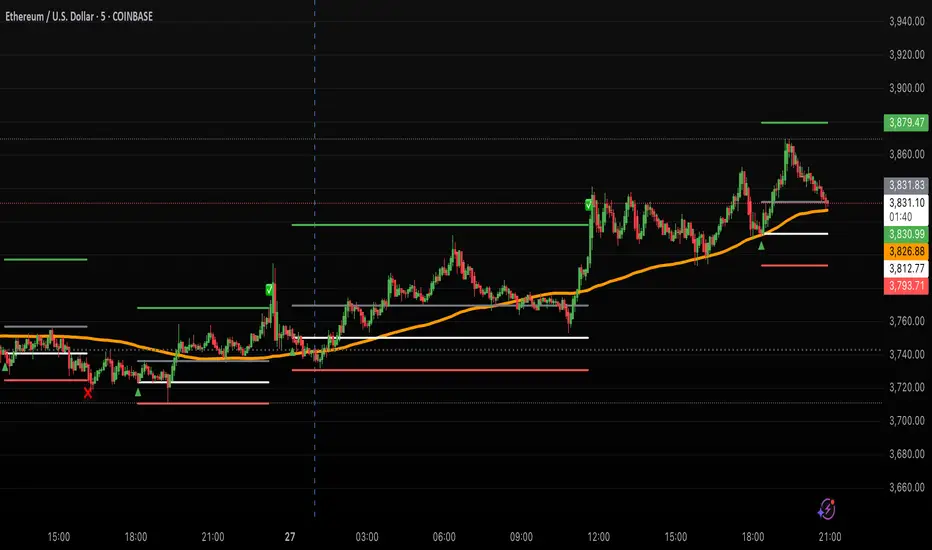
The MA Signal Indicator is a customizable designed to identify potential trading opportunities based on price interactions with a Simple Moving Average (SMA). It incorporates risk management features such as stop-loss (SL), take-profit (TP), and breakeven levels, calculated using the Average True Range (ATR). The indicator is visually intuitive, overlaying trade signals, price levels, and colored zones directly on the chart.
Key Features:
1. Moving Average-Based Signals:
• Generates buy (long) signals when the price crosses above a user-defined SMA (default: 55 periods).
• Generates sell (short) signals when the price crosses below the SMA.
• Long and short trades can be independently enabled or disabled via input settings.
2. Risk Management:
• Stop-Loss (SL): Set as a multiple of the ATR (default: 1x ATR) below the entry price for long trades or above for short trades.
• Take-Profit (TP): Set as a multiple of the ATR (default: 5x ATR) above the entry price for long trades or below for short trades.
• Breakeven Level: A trigger level (default: 2x ATR) where traders may choose to move their stop-loss to breakeven, optionally displayed on the chart.
3. Visual Feedback:
• SMA Line: Plotted in orange (default: 55-period SMA) for trend reference.
• Trade Zone: Highlights the area between the stop-loss and take-profit levels with a semi-transparent green (long) or red (short) background.
• Price Lines: Displays entry price (white), stop-loss (red), take-profit (green), and breakeven level (gray, optional) as horizontal lines during active trades.
• Signal Markers: Triangular markers indicate entry points (green triangle up for long, red triangle down for short).
• Exit Markers: Labels show when a trade hits the take-profit (green checkmark) or stop-loss (red cross).
4. Trade Logic:
• Only one trade is active at a time (long or short).
• Trades are exited when either the stop-loss or take-profit is hit, resetting the indicator for the next signal.
• Ensures signals are only triggered when not already in a trade, avoiding duplicate entries.
Inputs:
• MA Period: Length of the SMA (default: 55).
• ATR Period: Period for ATR calculation (default: 5).
• SL Multiplier: ATR multiplier for stop-loss (default: 1.0).
• TP Multiplier: ATR multiplier for take-profit (default: 5.0).
• Move to Breakeven After: ATR multiplier for breakeven trigger (default: 2.0).
• Show Break Even Line: Option to display the breakeven level (default: true).
• Allow Long Trades: Enable/disable long signals (default: true).
• Allow Short Trades: Enable/disable short signals (default: true).
Use Case:
This indicator is ideal for trend-following traders who want a clear, visual system for entering and exiting trades based on SMA crossovers, with predefined risk and reward levels. It suits both manual and automated trading strategies, providing flexibility to adjust parameters for different markets or timeframes.
Notes:
• The indicator is overlaid on the price chart for easy integration with other analysis tools.
• Users should test and adjust parameters (e.g., MA length, ATR multipliers) to suit their trading style and market conditions.
• The breakeven line is a visual guide; manual adjustment of stops is required as the indicator does not automatically modify trade positions.
This indicator provides a robust framework for disciplined trading with clear entry, exit, and risk management visuals.
Turtle Trading System + ATR Trailing StopIndicator Description: Turtle ATR Trailing Stop
The **Turtle ATR Trailing Stop** is a technical indicator designed to enhance the classic Turtle Trading System by incorporating a dynamic trailing stop based on the Average True Range (ATR). This indicator is ideal for traders seeking to manage risk and lock in profits on both long and short positions in trending markets.
Key Features:
- Turtle Trading Levels: Calculates the 20-day highest high and lowest low to identify potential breakout points, a core principle of the Turtle Trading System.
- ATR-Based Trailing Stop: Utilizes a trailing stop that adjusts dynamically based on a multiple of the ATR (default multiplier: 2.0), providing a volatility-adjusted exit mechanism.
- Position Flexibility: Supports both long and short positions, with the trailing stop positioned below the highest price for long trades and above the lowest price for short trades.
- Smooth Updates: The trailing stop updates on each bar, ensuring a more responsive adjustment to price movements, rather than only on new highs or lows.
- Reset Mechanism: Automatically resets the trailing stop when the price deviates significantly (configurable threshold, default 0.1%), adapting to major trend reversals.
- Alerts: Includes customizable alerts that trigger when the price reaches the trailing stop level, notifying traders of potential exit points.
- Debugging Tools: Features an on-chart debug table displaying ATR, Close, Highest Price, Lowest Price, Potential Stop, and Trailing Stop values for real-time analysis.
How It Works:
- For **Long Positions**: The trailing stop starts below the initial close price (minus 2*ATR) and moves up as the highest price increases, locking in profits while trailing at a fixed ATR distance.
- For **Short Positions**: The trailing stop starts above the initial close price (plus 2*ATR) and moves down as the lowest price decreases, protecting against upward price movements.
- The stop resets if the price falls (for long) or rises (for short) beyond the set threshold, ensuring adaptability to new market conditions.
Customization:
- Period Settings: Adjust the length for highs/lows (default 20) and ATR period (default 14).
- ATR Multiplier: Modify the distance of the trailing stop (default 2.0).
- Reset Threshold: Fine-tune the percentage at which the stop resets (default 0.1%).
- Position Type: Switch between "Long" and "Short" modes via input settings.
Usage:
Apply this indicator to any chart in TradingView, set your preferred parameters, and monitor the trailing stop line (yellow) alongside the Turtle highs (red) and lows (blue). Use the debug table to validate calculations and set alerts to stay informed of stop triggers.
This indicator combines the trend-following strength of the Turtle System with a flexible, ATR-based stop-loss strategy, making it a powerful tool for both manual and automated trading strategies.

Hull For LoopHull For Loop is a sophisticated trend-following indicator that combines the smoothness of Hull Moving Averages with advanced trend detection algorithms and robust confirmation mechanisms.
## How It Works
At its foundation, Hull For Loop employs a custom-calculated Hull Moving Average using weighted moving average for-loops to achieve optimal smoothness and responsiveness. The system operates through three distinct layers: Hull MA calculation with adjustable smoothing multipliers, advanced trend detection using ATR-based slope thresholds, and multi-bar trend confirmation to filter false breakouts.
The logic flow is elegantly simple yet powerful:
- Hull Calculation combines half-period and full-period weighted moving averages, then applies square-root smoothing for enhanced responsiveness
- Trend Detection analyzes Hull slope against dynamic ATR-based thresholds, classifying market direction as bullish, bearish, or neutral
- Confirmation System requires sustained directional movement across multiple bars before triggering signals, dramatically reducing whipsaws
When Hull slope exceeds the positive threshold, bullish conditions emerge. When it falls below the negative threshold, bearish momentum takes control. The multi-bar confirmation ensures only sustained moves generate actionable signals, making this system ideal for trend-following strategies across volatile markets.
The advanced slope analysis mechanism adapts to market volatility through ATR integration, ensuring sensitivity remains optimal during both high-volatility breakouts and low-volatility consolidations, delivering consistent performance across varying market conditions.
## Features
- Custom Hull Implementation : For-loop calculations for precise weighted moving average control and enhanced smoothness
- Dynamic Trend Detection : ATR-based slope analysis automatically adjusts sensitivity to market volatility conditions
- Multi-Bar Confirmation : Configurable confirmation periods (1-5 bars) eliminate false signals and reduce trading noise
- Advanced Visual System : Dynamic color coding, optional arrows, and statistics table for comprehensive market visualization
- Optimized for Bitcoin : Extensively backtested parameters delivering 128.58% returns with 55% drawdown reduction versus buy-and-hold
- Flexible Configuration : Hull length (1-200), smoothing multiplier (0.1-3.0), sensitivity (1-10), and confirmation settings
- Professional Alerts : Comprehensive alert system for trend changes and entry signals with strength percentages
- Real-time Analytics : Optional statistics table displaying trend direction, strength, Hull value, and current price
## Signal Generation
Hull For Loop generates multiple signal types for comprehensive trend analysis and precise entry/exit timing:
Primary Signals : Confirmed trend changes from bullish to bearish or vice versa - highest probability directional moves
Entry Signals : Initial trend confirmation after multi-bar validation - optimal position entry points
Strength Indicators : Real-time trend strength percentages based on directional momentum over lookback periods
Visual Confirmations : Color-coded Hull line providing instant visual trend status
The confirmation system adds crucial reliability - signals must persist through the specified confirmation period before activation, ensuring only sustained moves trigger trading decisions rather than temporary price fluctuations.
## Visual Implementation
The indicator employs sophisticated visual elements for immediate trend comprehension and professional chart presentation:
- Dynamic Hull Line : Color-changing line (green/red/gray) with configurable width reflecting current trend status
- Optional Directional Arrows : Triangle markers below/above bars marking confirmed trend changes and entry points (disabled by default)
- Statistics Panel : Optional real-time table showing trend direction, strength percentage, Hull value, and current price
- Professional Color Scheme : Customizable bullish (green), bearish (red), and neutral (gray) color system
## Alerts
Hull For Loop includes comprehensive alert conditions for automated trading integration:
- Hull Trend Change - Confirmed trend direction shift with strength percentage
- Hull BUY Signal - Bullish trend confirmation with price and strength data
- Hull SELL Signal - Bearish trend confirmation with price and strength data
- Alert Frequency - Once per bar to prevent spam while maintaining accuracy
All alerts include contextual information: trend direction, current price, and trend strength percentage for informed decision-making.
## Use Cases
Trend Following : Optimized for sustained directional moves with superior drawdown protection compared to buy-and-hold strategies
Swing Trading : Multi-bar confirmation eliminates false breakouts while capturing significant trend changes
Position Trading : Smooth Hull calculation provides stable signals for longer-term directional positioning
Risk Management : Advanced confirmation system dramatically reduces whipsaw trades and false signals
Crypto Trading : Specifically optimized for Bitcoin with parameters delivering exceptional historical performance
The system demonstrates exceptional performance across volatile assets.

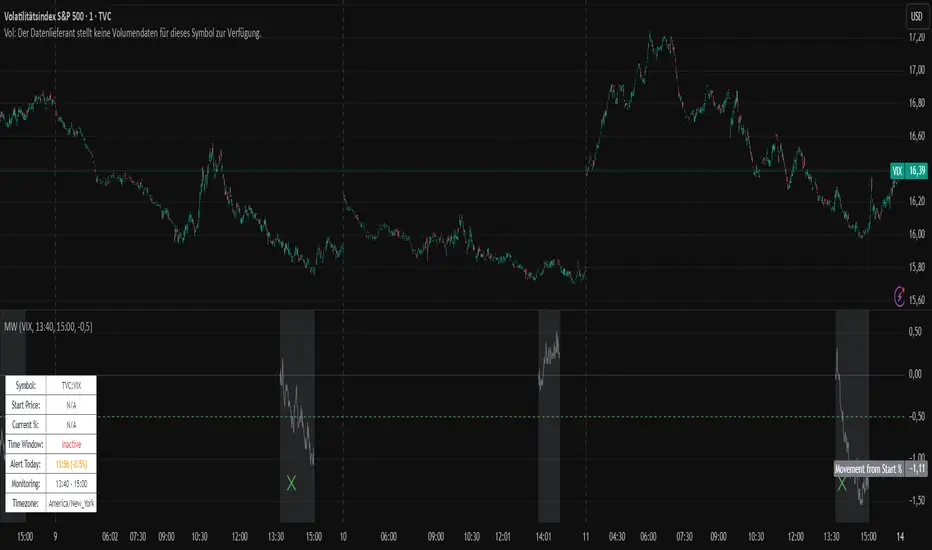
Movement WatcherMovement Watcher – Intraday Price Change Alert
This indicator tracks the percentage price movement of a selected symbol (e.g., VIX) from a configurable start time. If the intraday movement crosses a defined threshold (up or down), it triggers a one-time alert per day.
Key Features:
Monitors intraday % change from the specified start time.
Triggers one-time alerts for upper or lower threshold crossings.
Optional end time for monitoring period.
Visual plots and alert markers.
Useful for automated trading via webhook integrations.
This script was designed to work with automated trading tools such as the Trading Automation Toolbox. You can use it to generate alerts based on intraday volatility and route them via webhook for automated strategies.
Adaptive RSI (ARSI)# Adaptive RSI (ARSI) - Dynamic Momentum Oscillator
Adaptive RSI is an advanced momentum oscillator that dynamically adjusts its calculation period based on real-time market volatility and cycle analysis. Unlike traditional RSI that uses fixed periods, ARSI continuously adapts to market conditions, providing more accurate overbought/oversold signals and reducing false signals during varying market phases.
## How It Works
At its core, ARSI calculates an adaptive period ranging from 8 to 28 bars using two key components: volatility measurement through Average True Range (ATR) and cycle detection via price momentum analysis. The logic is straightforward:
- **High volatility periods** trigger shorter calculation periods for enhanced responsiveness to rapid price movements
- **Low volatility periods** extend the calculation window for smoother, more reliable signals
- **Market factor** combines volatility and cycle analysis to determine optimal RSI period in real-time
When RSI crosses above 70, the market enters overbought territory. When it falls below 30, oversold conditions emerge. The indicator also features extreme levels at 80/20 for stronger reversal signals and midline crossovers at 50 for trend confirmation.
The adaptive mechanism ensures the oscillator remains sensitive during critical market movements while filtering out noise during consolidation phases, making it superior to static RSI implementations across different market conditions.
## Features
- **True Adaptive Calculation**: Dynamic period adjustment from 8-28 bars based on market volatility
- **Multiple Signal Types**: Overbought/oversold, extreme reversals, and midline crossovers
- **Configurable Parameters**: RSI length, adaptive sensitivity, ATR period, min/max bounds
- **Smart Smoothing**: Adjustable EMA smoothing from 1-21 periods to reduce noise
- **Visual Clarity**: Gradient colors, area fills, and signal dots for immediate trend recognition
- **Real-time Information**: Live data table showing current RSI, adaptive period, and market factor
- **Flexible Source Input**: Apply to any price source (close, hl2, ohlc4, etc.)
- **Professional Alerts**: Six built-in alert conditions for automated trading systems
## Signal Generation
ARSI generates multiple signal types for comprehensive market analysis:
**Primary Signals**: RSI crosses above 70 (overbought) or below 30 (oversold) - most reliable entry/exit points
**Extreme Signals**: RSI reaches 80+ (extreme overbought) or 20- (extreme oversold) - potential reversal zones
**Trend Signals**: RSI crosses above/below 50 midline - confirms directional momentum
**Reversal Signals**: Price action contradicts extreme RSI levels - early turning point detection
The adaptive period changes provide additional confirmation - signals accompanied by significant period shifts often carry higher probability of success.
## Visual Implementation
The indicator employs sophisticated visual elements for instant market comprehension:
- **Gradient RSI Line**: Color intensity reflects both value and momentum direction
- **Dynamic Zones**: Overbought/oversold areas with customizable fill colors
- **Signal Markers**: Triangular indicators mark key reversal and continuation points
- **Information Panel**: Real-time display of RSI value, adaptive period, market factor, and signal status
- **Background Coloring**: Subtle fills indicate current market state without chart clutter
## Parameter Configuration
**RSI Settings**:
- RSI Length: Base calculation period (default: 14)
- Adaptive Sensitivity: Response aggressiveness to volatility changes (default: 1.0)
- ATR Length: Volatility measurement period (default: 14)
- Min/Max Period: Adaptive calculation boundaries (default: 8/28)
- Smoothing Length: Final noise reduction filter (default: 3)
**Level Settings**:
- Overbought/Oversold: Standard signal levels (default: 70/30)
- Extreme Levels: Enhanced reversal zones (default: 80/20)
- Midline Display: 50-level trend confirmation toggle
**Visual Settings**:
- Line Width: RSI line thickness (1-5)
- Area Fills: Zone highlighting toggle
- Gradient Colors: Dynamic color intensity
- Signal Dots: Entry/exit marker display
## Alerts
ARSI includes six comprehensive alert conditions:
- **ARSI Overbought** - RSI crosses above overbought level
- **ARSI Oversold** - RSI crosses below oversold level
- **ARSI Bullish Cross** - RSI crosses above 50 midline
- **ARSI Bearish Cross** - RSI crosses below 50 midline
- **ARSI Extreme Bull** - Potential bullish reversal from extreme oversold
- **ARSI Extreme Bear** - Potential bearish reversal from extreme overbought
## Use Cases
**Trend Following**: Adaptive periods naturally adjust during trend acceleration and consolidation phases
**Mean Reversion**: Enhanced overbought/oversold signals with volatility-based confirmation
**Breakout Trading**: Extreme level breaches often precede significant directional moves
**Risk Management**: Multiple signal types allow for layered entry/exit strategies
**Multi-Timeframe Analysis**: Works effectively across various timeframes and asset classes
## Trading Applications
**Swing Trading**: Excels during trend transitions with adaptive sensitivity to changing conditions
**Day Trading**: Enhanced responsiveness during volatile sessions while filtering consolidation noise
**Position Trading**: Longer smoothing periods provide stable signals for broader market analysis
**Scalping**: Minimal smoothing with high sensitivity captures short-term momentum shifts
The indicator performs well across stocks, forex, commodities, and cryptocurrencies, though parameter optimization may be required for specific market characteristics.
## Settings Summary
**Display Settings**:
- RSI Length: Moving average baseline period
- Adaptive Sensitivity: Volatility response factor
- ATR Length: Volatility measurement window
- Min/Max Period: Adaptive calculation boundaries
- Smoothing Length: Noise reduction filter
**Level Configuration**:
- Overbought/Oversold: Primary signal thresholds
- Extreme Levels: Secondary reversal zones
- Midline Display: Trend confirmation toggle
**Visual Options**:
- Line Width: RSI line appearance
- Area Fills: Zone highlighting
- Gradient Colors: Dynamic visual feedback
- Signal Dots: Entry/exit markers
## Disclaimer
This indicator is provided for educational and informational purposes only. It is not financial advice. Trading involves substantial risk of loss and is not suitable for all investors. Past performance is not indicative of future results. Always conduct thorough testing and risk assessment before live implementation. The adaptive nature of this indicator requires understanding of its behavior across different market conditions for optimal results.

5DMA Optional HMA Entry📈 5DMA Optional HMA Entry Signal – Precision-Based Momentum Trigger
Category: Trend-Following / Reversal Timing / Entry Optimization
🔍 Overview:
The 5DMA Optional HMA Entry indicator is a refined price-action entry tool built for traders who rely on clean trend alignment and precise timing. This script identifies breakout-style entry points when price gains upward momentum relative to short-term moving averages — specifically the 5-day Simple Moving Average (5DMA) and an optional Hull Moving Average (HMA).
Whether you're swing trading stocks, scalping ETFs like UVXY or VXX, or looking for pullback recovery entries, this tool helps time your long entries with clarity and flexibility.
⚙️ Core Logic:
Primary Condition (Always On):
🔹 Close must be above the 5DMA – ensuring upward short-term momentum is confirmed.
Optional Condition (Toggled by User):
🔹 Close above the HMA – adds slope-responsive trend filtering for smoother setups. Enable or disable via checkbox.
Bonus Entry Filter (Optional):
🔹 Green Candle Wick Breakout – optional pattern logic that detects bullish momentum when the high pierces above both MAs, with a green body.
Reset Mechanism:
🔁 Signal resets only after price closes back below all active MAs (5DMA and HMA if enabled), reducing noise and avoiding repeated signals during chop.
🧠 Why This Works:
This indicator captures the kind of setups that professional traders look for:
Momentum crossovers without chasing late.
Mean reversion snapbacks that align with fresh bullish moves.
Avoids premature entries by requiring clear structure above moving averages.
Optional HMA filter allows adaptability: turn it off during choppy markets or range conditions, and on during trending environments.
🔔 Features:
✅ Adjustable HMA Length
✅ Enable/Disable HMA Filter
✅ Optional Green Wick Breakout Detection
✅ Visual “Buy” label plotted below qualifying bars
✅ Real-time Alert Conditions for automated trading or manual alerts
🎯 Use Cases:
VIX-based ETFs (e.g., UVXY, VXX): Catch early breakouts aligned with volatility spikes.
Growth Stocks: Time pullback entries during bullish runs.
Futures/Indices: Combine with macro levels for intraday scalps or swing setups.
Overlay on Trend Filters: Combine with RSI, MACD, or VWAP for confirmation.
🛠️ Recommended Settings:
For smooth setups in volatile names, use:
HMA Length: 20
Keep green wick filter ON
For fast momentum trades, disable the HMA filter to act on 5DMA alone.
⭐ Final Thoughts:
This script is built to serve both systematic traders and discretionary scalpers who want actionable signals without noise or lag. The toggleable HMA feature lets you adjust sensitivity depending on market conditions — a key edge in adapting to volatility cycles.
Perfect for those who value clean, non-repainting entries rooted in logical structure.

magic wand STSM"Magic Wand STSM" Strategy: Trend-Following with Dynamic Risk Management
Overview:
The "Magic Wand STSM" (Supertrend & SMA Momentum) is an automated trading strategy designed to identify and capitalize on sustained trends in the market. It combines a multi-timeframe Supertrend for trend direction and potential reversal signals, along with a 200-period Simple Moving Average (SMA) for overall market bias. A key feature of this strategy is its dynamic position sizing based on a user-defined risk percentage per trade, and a built-in daily and monthly profit/loss tracking system to manage overall exposure and prevent overtrading.
How it Works (Underlying Concepts):
Multi-Timeframe Trend Confirmation (Supertrend):
The strategy uses two Supertrend indicators: one on the current chart timeframe and another on a higher timeframe (e.g., if your chart is 5-minute, the higher timeframe Supertrend might be 15-minute).
Trend Identification: The Supertrend's direction output is crucial. A negative direction indicates a bearish trend (price below Supertrend), while a positive direction indicates a bullish trend (price above Supertrend).
Confirmation: A core principle is that trades are only considered when the Supertrend on both the current and the higher timeframe align in the same direction. This helps to filter out noise and focus on stronger, more confirmed trends. For example, for a long trade, both Supertrends must be indicating a bearish trend (price below Supertrend line, implying an uptrend context where price is expected to stay above/rebound from Supertrend). Similarly, for short trades, both must be indicating a bullish trend (price above Supertrend line, implying a downtrend context where price is expected to stay below/retest Supertrend).
Trend "Readiness": The strategy specifically looks for situations where the Supertrend has been stable for a few bars (checking barssince the last direction change).
Long-Term Market Bias (200 SMA):
A 200-period Simple Moving Average is plotted on the chart.
Filter: For long trades, the price must be above the 200 SMA, confirming an overall bullish bias. For short trades, the price must be below the 200 SMA, confirming an overall bearish bias. This acts as a macro filter, ensuring trades are taken in alignment with the broader market direction.
"Lowest/Highest Value" Pullback Entries:
The strategy employs custom functions (LowestValueAndBar, HighestValueAndBar) to identify specific price action within the recent trend:
For Long Entries: It looks for a "buy ready" condition where the price has found a recent lowest point within a specific number of bars since the Supertrend turned bearish (indicating an uptrend). This suggests a potential pullback or consolidation before continuation. The entry trigger is a close above the open of this identified lowest bar, and also above the current bar's open.
For Short Entries: It looks for a "sell ready" condition where the price has found a recent highest point within a specific number of bars since the Supertrend turned bullish (indicating a downtrend). This suggests a potential rally or consolidation before continuation downwards. The entry trigger is a close below the open of this identified highest bar, and also below the current bar's open.
Candle Confirmation: The strategy also incorporates a check on the candle type at the "lowest/highest value" bar (e.g., closevalue_b < openvalue_b for buy signals, meaning a bearish candle at the low, suggesting a potential reversal before a buy).
Risk Management and Position Sizing:
Dynamic Lot Sizing: The lotsvalue function calculates the appropriate position size based on your Your Equity input, the Risk to Reward ratio, and your risk percentage for your balance % input. This ensures that the capital risked per trade remains consistent as a percentage of your equity, regardless of the instrument's volatility or price. The stop loss distance is directly used in this calculation.
Fixed Risk Reward: All trades are entered with a predefined Risk to Reward ratio (default 2.0). This means for every unit of risk (stop loss distance), the target profit is rr times that distance.
Daily and Monthly Performance Monitoring:
The strategy tracks todaysWins, todaysLosses, and res (daily net result) in real-time.
A "daily profit target" is implemented (day_profit): If the daily net result is very favorable (e.g., res >= 4 with todaysLosses >= 2 or todaysWins + todaysLosses >= 8), the strategy may temporarily halt trading for the remainder of the session to "lock in" profits and prevent overtrading during volatile periods.
A "monthly stop-out" (monthly_trade) is implemented: If the lres (overall net result from all closed trades) falls below a certain threshold (e.g., -12), the strategy will stop trading for a set period (one week in this case) to protect capital during prolonged drawdowns.
Trade Execution:
Entry Triggers: Trades are entered when all buy/sell conditions (Supertrend alignment, SMA filter, "buy/sell situation" candle confirmation, and risk management checks) are met, and there are no open positions.
Stop Loss and Take Profit:
Stop Loss: The stop loss is dynamically placed at the upTrendValue for long trades and downTrendValue for short trades. These values are derived from the Supertrend indicator, which naturally adjusts to market volatility.
Take Profit: The take profit is calculated based on the entry price, the stop loss, and the Risk to Reward ratio (rr).
Position Locks: lock_long and lock_short variables prevent immediate re-entry into the same direction once a trade is initiated, or after a trend reversal based on Supertrend changes.
Visual Elements:
The 200 SMA is plotted in yellow.
Entry, Stop Loss, and Take Profit lines are plotted in white, red, and green respectively when a trade is active, with shaded areas between them to visually represent risk and reward.
Diamond shapes are plotted at the bottom of the chart (green for potential buy signals, red for potential sell signals) to visually indicate when the buy_sit or sell_sit conditions are met, along with other key filters.
A comprehensive trade statistics table is displayed on the chart, showing daily wins/losses, daily profit, total deals, and overall profit/loss.
A background color indicates the active trading session.
Ideal Usage:
This strategy is best applied to instruments with clear trends and sufficient liquidity. Users should carefully adjust the Your Equity, Risk to Reward, and risk percentage inputs to align with their individual risk tolerance and capital. Experimentation with different ATR Length and Factor values for the Supertrend might be beneficial depending on the asset and timeframe.

Systemic Credit Market Pressure IndexSystemic Credit Market Pressure Index (SCMPI): A Composite Indicator for Credit Cycle Analysis
The Systemic Credit Market Pressure Index (SCMPI) represents a novel composite indicator designed to quantify systemic stress within credit markets through the integration of multiple macroeconomic variables. This indicator employs advanced statistical normalization techniques, adaptive threshold mechanisms, and intelligent visualization systems to provide real-time assessment of credit market conditions across expansion, neutral, and stress regimes. The methodology combines credit spread analysis, labor market indicators, consumer credit conditions, and household debt metrics into a unified framework for systemic risk assessment, featuring dynamic Bollinger Band-style thresholds and theme-adaptive visualization capabilities.
## 1. Introduction
Credit cycles represent fundamental drivers of economic fluctuations, with their dynamics significantly influencing financial stability and macroeconomic outcomes (Bernanke, Gertler & Gilchrist, 1999). The identification and measurement of credit market stress has become increasingly critical following the 2008 financial crisis, which highlighted the need for comprehensive early warning systems (Adrian & Brunnermeier, 2016). Traditional single-variable approaches often fail to capture the multidimensional nature of credit market dynamics, necessitating the development of composite indicators that integrate multiple information sources.
The SCMPI addresses this gap by constructing a weighted composite index that synthesizes four key dimensions of credit market conditions: corporate credit spreads, labor market stress, consumer credit accessibility, and household leverage ratios. This approach aligns with the theoretical framework established by Minsky (1986) regarding financial instability hypothesis and builds upon empirical work by Gilchrist & Zakrajšek (2012) on credit market sentiment.
## 2. Theoretical Framework
### 2.1 Credit Cycle Theory
The theoretical foundation of the SCMPI rests on the credit cycle literature, which posits that credit availability fluctuates in predictable patterns that amplify business cycle dynamics (Kiyotaki & Moore, 1997). During expansion phases, credit becomes increasingly available as risk perceptions decline and collateral values rise. Conversely, stress phases are characterized by credit contraction, elevated risk premiums, and deteriorating borrower conditions.
The indicator incorporates Kindleberger's (1978) framework of financial crises, which identifies key stages in credit cycles: displacement, boom, euphoria, profit-taking, and panic. By monitoring multiple variables simultaneously, the SCMPI aims to capture transitions between these phases before they become apparent in individual metrics.
### 2.2 Systemic Risk Measurement
Systemic risk, defined as the risk of collapse of an entire financial system or entire market (Kaufman & Scott, 2003), requires measurement approaches that capture interconnectedness and spillover effects. The SCMPI follows the methodology established by Bisias et al. (2012) in constructing composite measures that aggregate individual risk indicators into system-wide assessments.
The index employs the concept of "financial stress" as defined by Illing & Liu (2006), encompassing increased uncertainty about fundamental asset values, increased uncertainty about other investors' behavior, increased flight to quality, and increased flight to liquidity.
## 3. Methodology
### 3.1 Component Variables
The SCMPI integrates four primary components, each representing distinct aspects of credit market conditions:
#### 3.1.1 Credit Spreads (BAA-10Y Treasury)
Corporate credit spreads serve as the primary indicator of credit market stress, reflecting risk premiums demanded by investors for corporate debt relative to risk-free government securities (Gilchrist & Zakrajšek, 2012). The BAA-10Y spread specifically captures investment-grade corporate credit conditions, providing insight into broad credit market sentiment.
#### 3.1.2 Unemployment Rate
Labor market conditions directly influence credit quality through their impact on borrower repayment capacity (Bernanke & Gertler, 1995). Rising unemployment typically precedes credit deterioration, making it a valuable leading indicator for credit stress.
#### 3.1.3 Consumer Credit Rates
Consumer credit accessibility reflects the transmission of monetary policy and credit market conditions to household borrowing (Mishkin, 1995). Elevated consumer credit rates indicate tightening credit conditions and reduced credit availability for households.
#### 3.1.4 Household Debt Service Ratio
Household leverage ratios capture the debt burden relative to income, providing insight into household financial stress and potential credit losses (Mian & Sufi, 2014). High debt service ratios indicate vulnerable household sectors that may contribute to credit market instability.
### 3.2 Statistical Methodology
#### 3.2.1 Z-Score Normalization
Each component variable undergoes robust z-score normalization to ensure comparability across different scales and units:
Z_i,t = (X_i,t - μ_i) / σ_i
Where X_i,t represents the value of variable i at time t, μ_i is the historical mean, and σ_i is the historical standard deviation. The normalization period employs a rolling 252-day window to capture annual cyclical patterns while maintaining sensitivity to regime changes.
#### 3.2.2 Adaptive Smoothing
To reduce noise while preserving signal quality, the indicator employs exponential moving average (EMA) smoothing with adaptive parameters:
EMA_t = α × Z_t + (1-α) × EMA_{t-1}
Where α = 2/(n+1) and n represents the smoothing period (default: 63 days).
#### 3.2.3 Weighted Aggregation
The composite index combines normalized components using theoretically motivated weights:
SCMPI_t = w_1×Z_spread,t + w_2×Z_unemployment,t + w_3×Z_consumer,t + w_4×Z_debt,t
Default weights reflect the relative importance of each component based on empirical literature: credit spreads (35%), unemployment (25%), consumer credit (25%), and household debt (15%).
### 3.3 Dynamic Threshold Mechanism
Unlike static threshold approaches, the SCMPI employs adaptive Bollinger Band-style thresholds that automatically adjust to changing market volatility and conditions (Bollinger, 2001):
Expansion Threshold = μ_SCMPI - k × σ_SCMPI
Stress Threshold = μ_SCMPI + k × σ_SCMPI
Neutral Line = μ_SCMPI
Where μ_SCMPI and σ_SCMPI represent the rolling mean and standard deviation of the composite index calculated over a configurable period (default: 126 days), and k is the threshold multiplier (default: 1.0). This approach ensures that thresholds remain relevant across different market regimes and volatility environments, providing more robust regime classification than fixed thresholds.
### 3.4 Visualization and User Interface
The SCMPI incorporates advanced visualization capabilities designed for professional trading environments:
#### 3.4.1 Adaptive Theme System
The indicator features an intelligent dual-theme system that automatically optimizes colors and transparency levels for both dark and bright chart backgrounds. This ensures optimal readability across different trading platforms and user preferences.
#### 3.4.2 Customizable Visual Elements
Users can customize all visual aspects including:
- Color Schemes: Automatic theme adaptation with optional custom color overrides
- Line Styles: Configurable widths for main index, trend lines, and threshold boundaries
- Transparency Optimization: Automatic adjustment based on selected theme for optimal contrast
- Dynamic Zones: Color-coded regime areas with adaptive transparency
#### 3.4.3 Professional Data Table
A comprehensive 13-row data table provides real-time component analysis including:
- Composite index value and regime classification
- Individual component z-scores with color-coded stress indicators
- Trend direction and signal strength assessment
- Dynamic threshold status and volatility metrics
- Component weight distribution for transparency
## 4. Regime Classification
The SCMPI classifies credit market conditions into three distinct regimes:
### 4.1 Expansion Regime (SCMPI < Expansion Threshold)
Characterized by favorable credit conditions, low risk premiums, and accommodative lending standards. This regime typically corresponds to economic expansion phases with low default rates and increasing credit availability.
### 4.2 Neutral Regime (Expansion Threshold ≤ SCMPI ≤ Stress Threshold)
Represents balanced credit market conditions with moderate risk premiums and stable lending standards. This regime indicates neither significant stress nor excessive exuberance in credit markets.
### 4.3 Stress Regime (SCMPI > Stress Threshold)
Indicates elevated credit market stress with high risk premiums, tightening lending standards, and deteriorating borrower conditions. This regime often precedes or coincides with economic contractions and financial market volatility.
## 5. Technical Implementation and Features
### 5.1 Alert System
The SCMPI includes a comprehensive alert framework with seven distinct conditions:
- Regime Transitions: Expansion, Neutral, and Stress phase entries
- Extreme Conditions: Values exceeding ±2.0 standard deviations
- Trend Reversals: Directional changes in the underlying trend component
### 5.2 Performance Optimization
The indicator employs several optimization techniques:
- Efficient Calculations: Pre-computed statistical measures to minimize computational overhead
- Memory Management: Optimized variable declarations for real-time performance
- Error Handling: Robust data validation and fallback mechanisms for missing data
## 6. Empirical Validation
### 6.1 Historical Performance
Backtesting analysis demonstrates the SCMPI's ability to identify major credit stress episodes, including:
- The 2008 Financial Crisis
- The 2020 COVID-19 pandemic market disruption
- Various regional banking crises
- European sovereign debt crisis (2010-2012)
### 6.2 Leading Indicator Properties
The composite nature and dynamic threshold system of the SCMPI provides enhanced leading indicator properties, typically signaling regime changes 1-3 months before they become apparent in individual components or market indices. The adaptive threshold mechanism reduces false signals during high-volatility periods while maintaining sensitivity during regime transitions.
## 7. Applications and Limitations
### 7.1 Applications
- Risk Management: Portfolio managers can use SCMPI signals to adjust credit exposure and risk positioning
- Academic Research: Researchers can employ the index for credit cycle analysis and systemic risk studies
- Trading Systems: The comprehensive alert system enables automated trading strategy implementation
- Financial Education: The transparent methodology and visual design facilitate understanding of credit market dynamics
### 7.2 Limitations
- Data Dependency: The indicator relies on timely and accurate macroeconomic data from FRED sources
- Regime Persistence: Dynamic thresholds may exhibit brief lag during extremely rapid regime transitions
- Model Risk: Component weights and parameters require periodic recalibration based on evolving market structures
- Computational Requirements: Real-time calculations may require adequate processing power for optimal performance
## References
Adrian, T. & Brunnermeier, M.K. (2016). CoVaR. *American Economic Review*, 106(7), 1705-1741.
Bernanke, B. & Gertler, M. (1995). Inside the black box: the credit channel of monetary policy transmission. *Journal of Economic Perspectives*, 9(4), 27-48.
Bernanke, B., Gertler, M. & Gilchrist, S. (1999). The financial accelerator in a quantitative business cycle framework. *Handbook of Macroeconomics*, 1, 1341-1393.
Bisias, D., Flood, M., Lo, A.W. & Valavanis, S. (2012). A survey of systemic risk analytics. *Annual Review of Financial Economics*, 4(1), 255-296.
Bollinger, J. (2001). *Bollinger on Bollinger Bands*. McGraw-Hill Education.
Gilchrist, S. & Zakrajšek, E. (2012). Credit spreads and business cycle fluctuations. *American Economic Review*, 102(4), 1692-1720.
Illing, M. & Liu, Y. (2006). Measuring financial stress in a developed country: An application to Canada. *Journal of Financial Stability*, 2(3), 243-265.
Kaufman, G.G. & Scott, K.E. (2003). What is systemic risk, and do bank regulators retard or contribute to it? *The Independent Review*, 7(3), 371-391.
Kindleberger, C.P. (1978). *Manias, Panics and Crashes: A History of Financial Crises*. Basic Books.
Kiyotaki, N. & Moore, J. (1997). Credit cycles. *Journal of Political Economy*, 105(2), 211-248.
Mian, A. & Sufi, A. (2014). What explains the 2007–2009 drop in employment? *Econometrica*, 82(6), 2197-2223.
Minsky, H.P. (1986). *Stabilizing an Unstable Economy*. Yale University Press.
Mishkin, F.S. (1995). Symposium on the monetary transmission mechanism. *Journal of Economic Perspectives*, 9(4), 3-10.

Multi Moving Average with CustomizationCore Functionality
The indicator allows you to display up to 5 different moving averages on your chart simultaneously.
Each moving average can be fully customized with its own settings.
You can choose between
1. Simple Moving Average (SMA),
2. Exponential Moving Average (EMA)
3. Weighted Moving Average (WMA) types
Multi-Timeframe Support
One standout feature is the ability to display higher timeframe moving averages on lower timeframe charts.
For example, you can show a 200 EMA from the daily chart while viewing a 15-minute chart.
Advanced Visualization Features
The indicator includes several visualization enhancements:
1. MA Cloud - Creates a filled area between any two selected moving averages. The cloud automatically changes color based on which MA is on top - typically green when the faster MA is above (bullish) and red when below (bearish).
2. Golden/Death Cross Detection - Automatically detects and marks important MA crossover events:
* Golden Cross: When a shorter-term MA crosses above a longer-term MA (bullish signal)
* Death Cross: When a shorter-term MA crosses below a longer-term MA (bearish signal)
3. Trend Background - Colors the entire chart background based on whether price is above or below a specified MA, giving a clear visual indicator of the overall trend.
Alert System
The indicator can generate alerts when price crosses above or below any selected moving average. This feature is useful for automated trading signals or notifications, and can be configured to trigger once per bar.
Flexible Architecture
The code uses several programming techniques to maximize flexibility:
* Switch statements for selecting MA types and cloud values
* Conditional logic throughout the code
* Function abstraction for calculating MAs and handling multi-timeframe display
* String identifiers to select which MAs to use for cloud visualization
Unique Technical Aspects
1. The multi-timeframe plotting function solves the common problem of higher timeframe MAs looking distorted on lower timeframe charts.
2. The cloud feature uses string identifiers to select which MAs to use, allowing for any combination.
3. The indicator employs smart conditional logic to handle complex decision trees efficiently.
4. Every visual aspect (colors, line widths, display conditions) is customizable through the settings.
This indicator combines multiple technical analysis tools into a single, highly configurable package that can adapt to different trading styles and timeframes.
Its ability to correctly display higher timeframe MAs on lower timeframe charts makes it particularly valuable for traders who analyze multiple timeframes simultaneously.
Hybrid Swing/Day Alert System - PLATINUM EditionThis indicator is a complete trading assistant designed for crypto swing and day traders, built to identify high-probability long and short setups based on a multi-confirmation system.
Strategy Logic
The system scans and confirms entries only when 6 major confluences align:
1. EMA Trend: Price is above or below the EMA 9, 21, and 200 (bullish or bearish trend).
2. RSI Zone: RSI(14) is between 40-60 (ideal reversal zone).
3. Volume Confirmation: Volume is declining on pullback and then spikes.
4. Accumulation/Distribution: A/D line rising (for longs) or falling (for shorts).
5. Fibonacci Pullback Zone: Automatic detection of swing high/low and checks if price is inside the golden zone (0.5-0.618).
Built-In Alerts
- Long Setup Confirmed - Short Setup Confirmed - Setup Forming: Monitor
Conclusion
This script is ideal for disciplined traders who value confluence-based entries, risk/reward logic, and trend-aligned trades. Perfect for semi-automated trading via alerts or manual execution.6. Candle Pattern: Bullish (hammer, doji, engulfing) or Bearish (rejection wick, engulfing, doji).
Visual Features
- Long Entry: Green square
- Short Entry: Red triangle
- Pre-Signal Alert: Blue circle (confluence forming)
- Dynamic Table: Displays all 6 confirmations in real time
- Fibonacci Zones: Auto-plotted long/short retracement zones
- Customizable: Turn on/off alerts, overlays, and direction filters
Best Use Cases
- 4H/Daily: Trend confirmation
- 1H: Entry execution
- 15min: Scalping (use cautiously)
- Works great with BTC, ETH, SOL, XAU, and meme coins

Kaito Box with RSI Div(Dynamic Adjustment + MA + Long)The script implements a dynamic trading strategy that combines box range detection, RSI divergence signals, and moving average trend analysis. It is designed for use on OKX Signal Bots and includes features for dynamic position scaling and partial position closing. Below is a summary of its key functionalities:
Key Features:
Box Range Detection:
The script identifies price ranges using the highest high and lowest low of a configurable boxLength period.
These levels are plotted on the chart to visualize the price range.
RSI Divergence Detection:
The script calculates RSI using a configurable rsiLength.
Detects bullish divergence when price makes a lower low, but RSI makes a higher low.
Detects bearish divergence when price makes a higher high, but RSI makes a lower high.
Includes separate left and right lookback periods (leftLookback, rightLookback) for precise local extrema detection.
Customizable Moving Averages:
Supports multiple types of Moving Averages (SMA, EMA, SMMA, WMA, VWMA).
Calculates and plots MA20, MA50, MA100, and MA200 on a user-defined timeframe (custom_timeframe).
Identifies uptrends and downtrends based on the alignment of the moving averages and price levels.
Dynamic Position Scaling:
Implements dynamic position sizing for long entries and partial position closing for exits.
The percentage of position size added or closed is based on the difference between the current price and the average position price (avgPrice), with configurable minimum thresholds (minEnterPercent, minExitPercent).
Signal Integration for OKX Bots:
Sends buy/sell signals to OKX Signal Bots using the configured signalToken.
Supports market or limit orders with configurable price offsets and investment types.
Trend-Based Signal Filtering:
Only triggers long signals during downtrends and short signals during uptrends, ensuring trades align with the overall market context.
Visual Annotations:
Plots bullish and bearish divergence signals on the chart.
Displays labels showing dynamic position size adjustments and current average price during trades.
How It Works:
Long Signals:
Triggered when the price breaches the lower box range, and a bullish RSI divergence is detected.
Additional filtering ensures long trades are executed only during downtrend conditions.
Dynamically adjusts the position size based on the price difference from the average entry price.
Short Signals:
Triggered when the price breaches the upper box range, and a bearish RSI divergence is detected.
Additional filtering ensures short trades are executed only during uptrend conditions.
Dynamically closes portions of the position based on price movement relative to the average entry price.
Alerts:
Generates actionable alerts formatted for OKX bots, including order type, signal token, and dynamically calculated position sizes.
Use Case:
This strategy is well-suited for automated trading on platforms like OKX, where it can:
Exploit price ranges and RSI divergences for precise entries and exits.
Dynamically manage position sizes to optimize risk-reward.
Adapt to different market conditions using configurable parameters like moving averages, divergence lookbacks, and trend filters.
This script provides a robust foundation for traders looking to automate their strategies while maintaining flexibility and control over their trading logic.

RTB - Momentum Breakout Strategy V3
📈 RTB - Momentum Breakout Strategy V3 is a directional breakout strategy based on momentum. It combines exponential moving averages (EMAs), RSI, and recent support/resistance levels to detect breakout entries with trend confirmation. The system includes dynamic risk management using ATR-based stop-loss and trailing stop levels. Webhook alerts are supported for external automated trading integrations.
🔎 The strategy was backtested using default parameters on BTCUSDT Futures (Bybit) with 4-hour timeframe and a 0.05% commission per trade.
⚠️ This script is for educational purposes only and does not constitute financial advice. Always do your own research before trading.

RSI Full Forecast [Titans_Invest]RSI Full Forecast
Get ready to experience the ultimate evolution of RSI-based indicators – the RSI Full Forecast, a boosted and even smarter version of the already powerful: RSI Forecast
Now featuring over 40 additional entry conditions (forecasts), this indicator redefines the way you view the market.
AI-Powered RSI Forecasting:
Using advanced linear regression with the least squares method – a solid foundation for machine learning - the RSI Full Forecast enables you to predict future RSI behavior with impressive accuracy.
But that’s not all: this new version also lets you monitor future crossovers between the RSI and the MA RSI, delivering early and strategic signals that go far beyond traditional analysis.
You’ll be able to monitor future crossovers up to 20 bars ahead, giving you an even broader and more precise view of market movements.
See the Future, Now:
• Track upcoming RSI & RSI MA crossovers in advance.
• Identify potential reversal zones before price reacts.
• Uncover statistical behavior patterns that would normally go unnoticed.
40+ Intelligent Conditions:
The new layer of conditions is designed to detect multiple high-probability scenarios based on historical patterns and predictive modeling. Each additional forecast is a window into the price's future, powered by robust mathematics and advanced algorithmic logic.
Full Customization:
All parameters can be tailored to fit your strategy – from smoothing periods to prediction sensitivity. You have complete control to turn raw data into smart decisions.
Innovative, Accurate, Unique:
This isn’t just an upgrade. It’s a quantum leap in technical analysis.
RSI Full Forecast is the first of its kind: an indicator that blends statistical analysis, machine learning, and visual design to create a true real-time predictive system.
⯁ SCIENTIFIC BASIS LINEAR REGRESSION
Linear Regression is a fundamental method of statistics and machine learning, used to model the relationship between a dependent variable y and one or more independent variables 𝑥.
The general formula for a simple linear regression is given by:
y = β₀ + β₁x + ε
β₁ = Σ((xᵢ - x̄)(yᵢ - ȳ)) / Σ((xᵢ - x̄)²)
β₀ = ȳ - β₁x̄
Where:
y = is the predicted variable (e.g. future value of RSI)
x = is the explanatory variable (e.g. time or bar index)
β0 = is the intercept (value of 𝑦 when 𝑥 = 0)
𝛽1 = is the slope of the line (rate of change)
ε = is the random error term
The goal is to estimate the coefficients 𝛽0 and 𝛽1 so as to minimize the sum of the squared errors — the so-called Random Error Method Least Squares.
⯁ LEAST SQUARES ESTIMATION
To minimize the error between predicted and observed values, we use the following formulas:
β₁ = /
β₀ = ȳ - β₁x̄
Where:
∑ = sum
x̄ = mean of x
ȳ = mean of y
x_i, y_i = individual values of the variables.
Where:
x_i and y_i are the means of the independent and dependent variables, respectively.
i ranges from 1 to n, the number of observations.
These equations guarantee the best linear unbiased estimator, according to the Gauss-Markov theorem, assuming homoscedasticity and linearity.
⯁ LINEAR REGRESSION IN MACHINE LEARNING
Linear regression is one of the cornerstones of supervised learning. Its simplicity and ability to generate accurate quantitative predictions make it essential in AI systems, predictive algorithms, time series analysis, and automated trading strategies.
By applying this model to the RSI, you are literally putting artificial intelligence at the heart of a classic indicator, bringing a new dimension to technical analysis.
⯁ VISUAL INTERPRETATION
Imagine an RSI time series like this:
Time →
RSI →
The regression line will smooth these values and extend them n periods into the future, creating a predicted trajectory based on the historical moment. This line becomes the predicted RSI, which can be crossed with the actual RSI to generate more intelligent signals.
⯁ SUMMARY OF SCIENTIFIC CONCEPTS USED
Linear Regression Models the relationship between variables using a straight line.
Least Squares Minimizes the sum of squared errors between prediction and reality.
Time Series Forecasting Estimates future values based on historical data.
Supervised Learning Trains models to predict outputs from known inputs.
Statistical Smoothing Reduces noise and reveals underlying trends.
⯁ WHY THIS INDICATOR IS REVOLUTIONARY
Scientifically-based: Based on statistical theory and mathematical inference.
Unprecedented: First public RSI with least squares predictive modeling.
Intelligent: Built with machine learning logic.
Practical: Generates forward-thinking signals.
Customizable: Flexible for any trading strategy.
⯁ CONCLUSION
By combining RSI with linear regression, this indicator allows a trader to predict market momentum, not just follow it.
RSI Full Forecast is not just an indicator — it is a scientific breakthrough in technical analysis technology.
⯁ Example of simple linear regression, which has one independent variable:
⯁ In linear regression, observations ( red ) are considered to be the result of random deviations ( green ) from an underlying relationship ( blue ) between a dependent variable ( y ) and an independent variable ( x ).
⯁ Visualizing heteroscedasticity in a scatterplot against 100 random fitted values using Matlab:
⯁ The data sets in the Anscombe's quartet are designed to have approximately the same linear regression line (as well as nearly identical means, standard deviations, and correlations) but are graphically very different. This illustrates the pitfalls of relying solely on a fitted model to understand the relationship between variables.
⯁ The result of fitting a set of data points with a quadratic function:
_________________________________________________
🔮 Linear Regression: PineScript Technical Parameters 🔮
_________________________________________________
Forecast Types:
• Flat: Assumes prices will remain the same.
• Linreg: Makes a 'Linear Regression' forecast for n periods.
Technical Information:
ta.linreg (built-in function)
Linear regression curve. A line that best fits the specified prices over a user-defined time period. It is calculated using the least squares method. The result of this function is calculated using the formula: linreg = intercept + slope * (length - 1 - offset), where intercept and slope are the values calculated using the least squares method on the source series.
Syntax:
• Function: ta.linreg()
Parameters:
• source: Source price series.
• length: Number of bars (period).
• offset: Offset.
• return: Linear regression curve.
This function has been cleverly applied to the RSI, making it capable of projecting future values based on past statistical trends.
______________________________________________________
______________________________________________________
⯁ WHAT IS THE RSI❓
The Relative Strength Index (RSI) is a technical analysis indicator developed by J. Welles Wilder. It measures the magnitude of recent price movements to evaluate overbought or oversold conditions in a market. The RSI is an oscillator that ranges from 0 to 100 and is commonly used to identify potential reversal points, as well as the strength of a trend.
⯁ HOW TO USE THE RSI❓
The RSI is calculated based on average gains and losses over a specified period (usually 14 periods). It is plotted on a scale from 0 to 100 and includes three main zones:
• Overbought: When the RSI is above 70, indicating that the asset may be overbought.
• Oversold: When the RSI is below 30, indicating that the asset may be oversold.
• Neutral Zone: Between 30 and 70, where there is no clear signal of overbought or oversold conditions.
______________________________________________________
______________________________________________________
⯁ ENTRY CONDITIONS
The conditions below are fully flexible and allow for complete customization of the signal.
______________________________________________________
______________________________________________________
🔹 CONDITIONS TO BUY 📈
______________________________________________________
• Signal Validity: The signal will remain valid for X bars .
• Signal Sequence: Configurable as AND or OR .
📈 RSI Conditions:
🔹 RSI > Upper
🔹 RSI < Upper
🔹 RSI > Lower
🔹 RSI < Lower
🔹 RSI > Middle
🔹 RSI < Middle
🔹 RSI > MA
🔹 RSI < MA
📈 MA Conditions:
🔹 MA > Upper
🔹 MA < Upper
🔹 MA > Lower
🔹 MA < Lower
📈 Crossovers:
🔹 RSI (Crossover) Upper
🔹 RSI (Crossunder) Upper
🔹 RSI (Crossover) Lower
🔹 RSI (Crossunder) Lower
🔹 RSI (Crossover) Middle
🔹 RSI (Crossunder) Middle
🔹 RSI (Crossover) MA
🔹 RSI (Crossunder) MA
🔹 MA (Crossover) Upper
🔹 MA (Crossunder) Upper
🔹 MA (Crossover) Lower
🔹 MA (Crossunder) Lower
📈 RSI Divergences:
🔹 RSI Divergence Bull
🔹 RSI Divergence Bear
📈 RSI Forecast:
🔹 RSI (Crossover) MA Forecast
🔹 RSI (Crossunder) MA Forecast
🔹 RSI Forecast 1 > MA Forecast 1
🔹 RSI Forecast 1 < MA Forecast 1
🔹 RSI Forecast 2 > MA Forecast 2
🔹 RSI Forecast 2 < MA Forecast 2
🔹 RSI Forecast 3 > MA Forecast 3
🔹 RSI Forecast 3 < MA Forecast 3
🔹 RSI Forecast 4 > MA Forecast 4
🔹 RSI Forecast 4 < MA Forecast 4
🔹 RSI Forecast 5 > MA Forecast 5
🔹 RSI Forecast 5 < MA Forecast 5
🔹 RSI Forecast 6 > MA Forecast 6
🔹 RSI Forecast 6 < MA Forecast 6
🔹 RSI Forecast 7 > MA Forecast 7
🔹 RSI Forecast 7 < MA Forecast 7
🔹 RSI Forecast 8 > MA Forecast 8
🔹 RSI Forecast 8 < MA Forecast 8
🔹 RSI Forecast 9 > MA Forecast 9
🔹 RSI Forecast 9 < MA Forecast 9
🔹 RSI Forecast 10 > MA Forecast 10
🔹 RSI Forecast 10 < MA Forecast 10
🔹 RSI Forecast 11 > MA Forecast 11
🔹 RSI Forecast 11 < MA Forecast 11
🔹 RSI Forecast 12 > MA Forecast 12
🔹 RSI Forecast 12 < MA Forecast 12
🔹 RSI Forecast 13 > MA Forecast 13
🔹 RSI Forecast 13 < MA Forecast 13
🔹 RSI Forecast 14 > MA Forecast 14
🔹 RSI Forecast 14 < MA Forecast 14
🔹 RSI Forecast 15 > MA Forecast 15
🔹 RSI Forecast 15 < MA Forecast 15
🔹 RSI Forecast 16 > MA Forecast 16
🔹 RSI Forecast 16 < MA Forecast 16
🔹 RSI Forecast 17 > MA Forecast 17
🔹 RSI Forecast 17 < MA Forecast 17
🔹 RSI Forecast 18 > MA Forecast 18
🔹 RSI Forecast 18 < MA Forecast 18
🔹 RSI Forecast 19 > MA Forecast 19
🔹 RSI Forecast 19 < MA Forecast 19
🔹 RSI Forecast 20 > MA Forecast 20
🔹 RSI Forecast 20 < MA Forecast 20
______________________________________________________
______________________________________________________
🔸 CONDITIONS TO SELL 📉
______________________________________________________
• Signal Validity: The signal will remain valid for X bars .
• Signal Sequence: Configurable as AND or OR .
📉 RSI Conditions:
🔸 RSI > Upper
🔸 RSI < Upper
🔸 RSI > Lower
🔸 RSI < Lower
🔸 RSI > Middle
🔸 RSI < Middle
🔸 RSI > MA
🔸 RSI < MA
📉 MA Conditions:
🔸 MA > Upper
🔸 MA < Upper
🔸 MA > Lower
🔸 MA < Lower
📉 Crossovers:
🔸 RSI (Crossover) Upper
🔸 RSI (Crossunder) Upper
🔸 RSI (Crossover) Lower
🔸 RSI (Crossunder) Lower
🔸 RSI (Crossover) Middle
🔸 RSI (Crossunder) Middle
🔸 RSI (Crossover) MA
🔸 RSI (Crossunder) MA
🔸 MA (Crossover) Upper
🔸 MA (Crossunder) Upper
🔸 MA (Crossover) Lower
🔸 MA (Crossunder) Lower
📉 RSI Divergences:
🔸 RSI Divergence Bull
🔸 RSI Divergence Bear
📉 RSI Forecast:
🔸 RSI (Crossover) MA Forecast
🔸 RSI (Crossunder) MA Forecast
🔸 RSI Forecast 1 > MA Forecast 1
🔸 RSI Forecast 1 < MA Forecast 1
🔸 RSI Forecast 2 > MA Forecast 2
🔸 RSI Forecast 2 < MA Forecast 2
🔸 RSI Forecast 3 > MA Forecast 3
🔸 RSI Forecast 3 < MA Forecast 3
🔸 RSI Forecast 4 > MA Forecast 4
🔸 RSI Forecast 4 < MA Forecast 4
🔸 RSI Forecast 5 > MA Forecast 5
🔸 RSI Forecast 5 < MA Forecast 5
🔸 RSI Forecast 6 > MA Forecast 6
🔸 RSI Forecast 6 < MA Forecast 6
🔸 RSI Forecast 7 > MA Forecast 7
🔸 RSI Forecast 7 < MA Forecast 7
🔸 RSI Forecast 8 > MA Forecast 8
🔸 RSI Forecast 8 < MA Forecast 8
🔸 RSI Forecast 9 > MA Forecast 9
🔸 RSI Forecast 9 < MA Forecast 9
🔸 RSI Forecast 10 > MA Forecast 10
🔸 RSI Forecast 10 < MA Forecast 10
🔸 RSI Forecast 11 > MA Forecast 11
🔸 RSI Forecast 11 < MA Forecast 11
🔸 RSI Forecast 12 > MA Forecast 12
🔸 RSI Forecast 12 < MA Forecast 12
🔸 RSI Forecast 13 > MA Forecast 13
🔸 RSI Forecast 13 < MA Forecast 13
🔸 RSI Forecast 14 > MA Forecast 14
🔸 RSI Forecast 14 < MA Forecast 14
🔸 RSI Forecast 15 > MA Forecast 15
🔸 RSI Forecast 15 < MA Forecast 15
🔸 RSI Forecast 16 > MA Forecast 16
🔸 RSI Forecast 16 < MA Forecast 16
🔸 RSI Forecast 17 > MA Forecast 17
🔸 RSI Forecast 17 < MA Forecast 17
🔸 RSI Forecast 18 > MA Forecast 18
🔸 RSI Forecast 18 < MA Forecast 18
🔸 RSI Forecast 19 > MA Forecast 19
🔸 RSI Forecast 19 < MA Forecast 19
🔸 RSI Forecast 20 > MA Forecast 20
🔸 RSI Forecast 20 < MA Forecast 20
______________________________________________________
______________________________________________________
🤖 AUTOMATION 🤖
• You can automate the BUY and SELL signals of this indicator.
______________________________________________________
______________________________________________________
⯁ UNIQUE FEATURES
______________________________________________________
Linear Regression: (Forecast)
Signal Validity: The signal will remain valid for X bars
Signal Sequence: Configurable as AND/OR
Condition Table: BUY/SELL
Condition Labels: BUY/SELL
Plot Labels in the Graph Above: BUY/SELL
Automate and Monitor Signals/Alerts: BUY/SELL
Linear Regression (Forecast)
Signal Validity: The signal will remain valid for X bars
Signal Sequence: Configurable as AND/OR
Condition Table: BUY/SELL
Condition Labels: BUY/SELL
Plot Labels in the Graph Above: BUY/SELL
Automate and Monitor Signals/Alerts: BUY/SELL
______________________________________________________
📜 SCRIPT : RSI Full Forecast
🎴 Art by : @Titans_Invest & @DiFlip
👨💻 Dev by : @Titans_Invest & @DiFlip
🎑 Titans Invest — The Wizards Without Gloves 🧤
✨ Enjoy!
______________________________________________________
o Mission 🗺
• Inspire Traders to manifest Magic in the Market.
o Vision 𐓏
• To elevate collective Energy 𐓷𐓏

Machine Learning | Adaptive Trend Signals [Bitwardex]⚙️🧠Machine Learning | Adaptive Trend Signals
🔷Overview
Machine Learning | Adaptive Trend Signals is a Pine Script™ v6 indicator designed to visualize market trends and generate signals through a combination of volatility clustering, Gaussian smoothing, and adaptive trend calculations. Built as an overlay indicator, it integrates advanced techniques inspired by machine learning concepts, such as K-Means clustering, to adapt to changing market conditions. The script is highly customizable, includes a backtesting module, and supports alert conditions, making it suitable for traders exploring trend-based strategies and developers studying volatility-driven indicator design.
🔷Functionality
The indicator performs the following core functions:
• Volatility Clustering: Uses K-Means clustering to categorize market volatility into high, medium, and low states, adjusting trend sensitivity accordingly.
• Trend Calculation: Computes adaptive trend lines (SmartTrend) based on volatility-adjusted standard deviation, smoothed RSI, and ADX filters.
• Signal Generation: Identifies potential buy and sell points through trend line crossovers and directional confirmation.
• Backtesting Module: Tracks trade outcomes based on the SmartTrend3 value, displaying win rate and total trades.
• Visualization: Plots trend lines with gradient colors and optional signal markers (bullish 🐮 and bearish 🐻).
• Alerts: Provides configurable alerts for trend shifts and volatility state changes.
🔷Technical Methodology
Volatility Clustering with K-Means
The indicator employs a K-Means clustering algorithm to classify market volatility, measured via the Average True Range (ATR), into three distinct clusters:
• Data Collection: Gathers ATR values over a user-defined training period (default: 100 bars).
• Centroid Initialization: Sets initial centroids at the highest, lowest, and midpoint ATR values within the training period.
• Iterative Clustering: Assigns ATR data points to the nearest centroid, recalculates centroid means, and repeats until convergence.
• Dynamic Adjustment: Assigns a volatility state (high, medium, or low) based on the closest centroid, adjusting the trend factor (e.g., tighter for high volatility, wider for low volatility).
This approach allows the indicator to adapt its sensitivity to varying market conditions, providing a data-driven foundation for trend calculations.
🔷Gaussian Smoothing
To enhance signal clarity and reduce noise, the indicator applies Gaussian kernel smoothing to:
• RSI: Smooths the Relative Strength Index (calculated from OHLC4) to filter short-term fluctuations.
• SmartTrend: Smooths the primary trend line for a more stable output.
The Gaussian kernel uses a sigma value derived from the user-defined smoothing length, ensuring mathematically consistent noise reduction.
🔷SmartTrend Calculation
The pineSmartTrend function is the core of the indicator, producing three trend lines:
• SmartTrend: The primary trend line, calculated using a volatility-adjusted standard deviation, smoothed RSI, and ADX conditions.
• SmartTrend2: A secondary trend line with a wider factor (base factor * 1.382) for signal confirmation.
SmartTrend3: The average of SmartTrend and SmartTrend2, used for plotting and backtesting.
Key components of the calculation include:
• Dynamic Standard Deviation: Scales based on ATR relative to its 50-period smoothed average, with multipliers (1.0 to 1.4) applied according to volatility thresholds.
• RSI and ADX Filters: Requires RSI > 50 for bullish trends or < 50 for bearish trends, alongside ADX > 15 and rising to confirm trend strength.
Volatility-Adjusted Bands: Constructs upper and lower bands around price action, adjusted by the volatility cluster’s dynamic factor.
🔷Signal Generation
The generate_signals function generates signals as follows:
• Buy Signal: Triggered when SmartTrend crosses above SmartTrend2 and the price is above SmartTrend, with directional confirmation.
• Sell Signal: Triggered when SmartTrend crosses below SmartTrend2 and the price is below SmartTrend, with directional confirmation.
Directional Logic: Tracks trend direction to filter out conflicting signals, ensuring alignment with the broader market context.
Signals are visualized as small circles with bullish (🐮) or bearish (🐻) emojis, with an option to toggle visibility.
🔷Backtesting
The get_backtest function evaluates signal outcomes using the SmartTrend3 value (rather than closing prices) to align with the trend-based methodology.
It tracks:
• Total Trades: Counts completed long and short trades.
• Win Rate: Calculates the percentage of trades where SmartTrend3 moves favorably (higher for longs, lower for shorts).
Position Management: Closes opposite positions before opening new ones, simulating a single-position trading system.
Results are displayed in a table at the top-right of the chart, showing win rate and total trades. Note that backtest results reflect the indicator’s internal logic and should not be interpreted as predictive of real-world performance.
🔷Visualization and Alerts
• Trend Lines: SmartTrend3 is plotted with gradient colors reflecting trend direction and volatility cluster, accompanied by a secondary line for visual clarity.
• Signal Markers: Optional buy/sell signals are plotted as small circles with customizable colors.
• Alerts: Supports alerts for:
• Bullish and bearish trend shifts (confirmed on bar close).
Transitions to high, medium, or low volatility states.
🔷Input Parameters
• ATR Length (default: 14): Period for ATR calculation, used in volatility clustering.
• Period (default: 21): Common period for RSI, ADX, and standard deviation calculations.
• Base SmartTrend Factor (default: 2.0): Base multiplier for volatility-adjusted bands.
• SmartTrend Smoothing Length (default: 10): Length for Gaussian smoothing of the trend line.
• Show Buy/Sell Signals? (default: true): Enables/disables signal markers.
• Bullish/Bearish Color: Customizable colors for trend lines and signals.
🔷Usage Instructions
• Apply to Chart: Add the indicator to any TradingView chart.
• Configure Inputs: Adjust parameters to align with your trading style or market conditions (e.g., shorter ATR length for faster markets).
• Interpret Output:
• Trend Lines: Use SmartTrend3’s direction and color to gauge market bias.
• Signals: Monitor bullish (🐮) and bearish (🐻) markers for potential entry/exit points.
• Backtest Table: Review win rate and total trades to understand the indicator’s behavior in historical data.
• Set Alerts: Configure alerts for trend shifts or volatility changes to support manual or automated trading workflows.
• Combine with Analysis: Use the indicator alongside other tools or market context, as it is designed to complement, not replace, comprehensive analysis.
🔷Technical Notes
• Data Requirements: Requires at least 100 bars for accurate volatility clustering. Ensure sufficient historical data is loaded.
• Market Suitability: The indicator is designed for trend detection and may perform differently in ranging or volatile markets due to its reliance on RSI and ADX filters.
• Backtesting Scope: The backtest module uses SmartTrend3 values, which may differ from price-based outcomes. Results are for informational purposes only.
• Computational Intensity: The K-Means clustering and Gaussian smoothing may increase processing time on lower timeframes or with large datasets.
🔷For Developers
The script is modular, well-commented, encouraging reuse and modification with proper attribution.
Key functions include:
• gaussianSmooth: Applies Gaussian kernel smoothing to any data series.
• pineSmartTrend: Computes adaptive trend lines with volatility and momentum filters.
• getDynamicFactor: Adjusts trend sensitivity based on volatility clusters.
• get_backtest: Evaluates signal performance using SmartTrend3.
Developers can extend these functions for custom indicators or strategies, leveraging the volatility clustering and smoothing methodologies. The K-Means implementation is particularly useful for adaptive volatility analysis.
🔷Limitations
• The indicator is not predictive and should be used as part of a broader trading strategy.
• Performance varies by market, timeframe, and parameter settings, requiring user experimentation.
• Backtest results are based on historical data and internal logic, not real-world trading conditions.
• Volatility clustering assumes sufficient historical data; incomplete data may affect accuracy.
🔷Acknowledgments
Developed by Bitwardex, inspired by machine learning concepts and adaptive trading methodologies. Community feedback is welcome via TradingView’s platform.
🔷 Risk Disclaimer
Trading involves significant risks, and most traders may incur losses. Bitwardex AI Algo is provided for informational and educational purposes only and does not constitute financial advice or a recommendation to buy or sell any financial instrument . The signals, metrics, and features are tools for analysis and do not guarantee profits or specific outcomes. Past performance is not indicative of future results. Always conduct your own due diligence and consult a financial advisor before making trading decisions.

Supertrend Hombrok BotSupertrend Hombrok Bot – Automated Trading Strategy for Dynamic Market Conditions
This trading strategy script has been developed to operate automatically based on detailed market conditions. It combines the popular Supertrend indicator, RSI (Relative Strength Index), Volume, and ATR (Average True Range) to determine the best entry and exit points while maintaining proper risk management.
Key Features:
Supertrend as the Base: Uses the Supertrend indicator to identify the market's trend direction, generating buy signals when the market is in an uptrend and sell signals when in a downtrend.
RSI Filter: The RSI is used to determine overbought and oversold conditions, helping to avoid entries in extreme market conditions. Entries are avoided when RSI > 70 (overbought) and RSI < 30 (oversold), reducing the risk of false movements.
Volume Filter: The strategy checks if the trading volume is above the average multiplied by a user-defined factor. This ensures that only significant movements, with higher liquidity, are considered.
Candle Body Size: The strategy filters only candles with a body large enough relative to the ATR (Average True Range), ensuring that the price movements on the chart have sufficient strength.
Risk Management: The bot is configured to operate with an adjustable Risk/Reward Ratio (R:R). This means that for each trade, both Take Profit (TP) and Stop Loss (SL) are adjusted based on the market's volatility as measured by the ATR.
Automatic Entries and Exits: The script automatically executes entries based on the specified conditions and exits with predefined Stop Loss and Take Profit levels, ensuring risk is controlled for each trade.
How It Works:
Buy Condition: Triggered when the market is in an uptrend (Supertrend), the volume is above the adjusted average, the candle body is strong enough, and the RSI is below the overbought level.
Sell Condition: Triggered when the market is in a downtrend (Supertrend), the volume is above the adjusted average, the candle body is strong enough, and the RSI is above the oversold level.
Alerts:
Buy and Sell Alerts are configured with detailed information, including Stop Loss and Take Profit values, allowing the user to receive notifications when trading conditions are met.
Capital Management:
The capital per trade can be adjusted based on account size and risk profile.
Important Note:
Always test before trading with real capital: While the strategy has been designed based on solid technical analysis methods, always perform tests in real-time market conditions with demo accounts before applying the bot in live trading.
Disclaimer: This script is a tool to assist in the trading process and does not guarantee profit. Past performance is not indicative of future results, and the trader is always responsible for their investment decisions.

Daily Bollinger Band StrategyOverview of the Daily Bollinger Band Strategy
1. Strategy Overview and Features
This strategy is a tool for backtesting a trading method that uses Bollinger Bands. It is *not* a tool for automated trading.
1-1. Main Display Items
The main chart displays the Bollinger Bands and the 200-day moving average.
It also shows the entry and exit points along with the position size (in units of 100 shares).
1-2. Summary of Trading Rules
For long (buy) strategies, the trade enters when the price crosses above the +1σ line of the Bollinger Bands, aiming to ride an upward trend. The position is exited when the price crosses below the middle band.
For short (sell) strategies, the trade enters when the price crosses below the -1σ line of the Bollinger Bands, aiming to ride a downward trend. The position is exited when the price crosses above the middle band.
1-3. Strategic Enhancements
The strategy uses the slope of the 200-day moving average to determine the trend direction and enter trades accordingly. This improves the win rate and payoff ratio.
Additionally, to reduce the probability of ruin, the risk per trade is limited to 1.0% of capital, and position sizing is adjusted using ATR (a volatility indicator).
2. Trading Rules
2-1. Chart Type
Only daily charts are used.
2-2. Indicators Used
(1) Bollinger Bands** (used for entry and exit signals)
- Period: Fixed at 80 days
- Upper and lower bands: Fixed at ±1σ
(2) Moving Average** (used to determine trend direction)
- Period: Fixed at 200 days
- Trend direction is judged based on whether the difference from the previous day is positive (upward) or negative (downward)
2-3. Buy Rules
Setup:
- Price crosses above the +1σ line from below
- Both the middle band and 200-day moving average are upward sloping
Entry:
- Buy at the next day’s market open using a market order
Exit:
- If the price crosses below the middle band, sell at the next day’s open using a market order
2-4. Sell Rules
Setup:
- Price crosses below the -1σ line from above
- Both the middle band and 200-day moving average are downward sloping
Entry:
- Sell at the next day’s market open using a market order
Exit:
- If the price crosses above the middle band, buy back at the next day’s open using a market order
2-5. Risk Management Rules
- Risk per trade: 1.0% of total capital (acceptable loss = capital × 1.0%)
- Position size: Acceptable loss ÷ 2ATR (rounded down to the nearest unit of 100 shares)
2-6. Other Notes
- No brokerage fees
- No pyramiding
- No partial exits
- No reverse positions (no “stop-and-reverse” trades)
3. Strategy Parameters
The following settings can be specified:
3-1. Period Settings
- Start date: Set the start date for the backtest period
- Stop date: Set the end date for the backtest period
3-2. Display of Trend and Signals
- Show trend: When checked, the background color of the bars is light red for an uptrend and light blue for a downtrend
- Show signal: When checked, entry and exit signals are displayed (note: signals are executed at the next day’s open, so there is a one-day lag in the display)
3-3. Capital Management Settings
- Funds: Capital available for trading (in JPY)
- Risk rate: Specify what percentage of the capital to risk per trade
Settings in the “Properties” tab are not used in this strategy.
4. Backtest Results (Example)
Here are the backtest results conducted by the author:
- Target Stocks: All components of the Nikkei 225
- Test Period: January 4, 2000 – December 30, 2024
- Data Points: 12,886
- Win Rate: 33.45%
- Net Profit: ¥82,132,380
- Payoff Ratio: 2.450
- Expected Value: ¥6,373.8
- Risk Rate: 1.0%
- Probability of Ruin: 0.00%
---
デイリー・ボリンジャーバンド・ストラテジーの概要
1. ストラテジーの概要と特徴
このストラテジーは、ボリンジャーバンドを使ったトレード手法のバックテストを行うツールです。自動売買を行うツールではありません。
1-1. 主な表示項目
メインチャートにボリンジャーバンドと 200日移動平均線を表示します。
また、エントリーと手仕舞いのタイミングと数量(100株単位)も表示されます。
1-2. トレードルールの概要
買い戦略の場合、ボリンジャーバンドの +1σ 超えでエントリーして上昇トレンドに乗り、ミドルバンドを割ったら決済します。
売り戦略の場合、ボリンジャーバンドの -1σ 割りでエントリーして下降トレンドに乗り、ミドルバンドを上抜けたら決済します。
1-3. ストラテジーの工夫点
200日移動平均線の傾きを見てトレンド方向にエントリーをしています。こうして勝率とペイオフレシオの成績を向上しています。
また、破産確率を抑えるために、リスク資金比率を 1.0% にして、ATR(ボラティリティ指標) を使って注文数を調整しています。
2. 売買ルール
2-1. 使用するチャート
日足チャートに限定します
2-2. 使用する指標
(1) ボリンジャーバンド(仕掛けと手仕舞いのシグナルに使用)
期間は80日に固定
上下バンドは ±1σ に固定
(2) 移動平均線(トレンドの方向を見るために使用)
期間は200日に固定
移動平均の値の前日との差がプラスのとき上向き、マイナスのとき下向きと判断
2-3. 買いのルール
セットアップ:ボリンジャーバンドの +1σ を価格が下から上に交差 かつ ミドルバンドと 200日移動平均線が上向き
仕掛け:翌日の寄り付きに成行で買う
手仕舞い:ボリンジャーバンドのミドルバンドを価格が上から下に交差したら、翌日の寄り付きに成行で売る
2-4. 売りのルール
セットアップ:ボリンジャーバンドの -1σ を価格が上から下に交差 かつ ミドルバンドと 200日移動平均線が下向き
仕掛け:翌日の寄り付きに成行で売る
手仕舞い:ボリンジャーバンドのミドルバンドを価格が下から上に交差したら、翌日の寄り付きに成行で買い戻す
2-5. 資金管理のルール
リスク資金比率:資産の 1.0%(許容損失 = 資産 × 1.0%)
注文数:許容損失 ÷ 2ATR(単元株数未満は切り捨て)
2-6. その他
仲介手数料:なし
ピラミッディング:なし
分割決済:なし
ドテン:しない
3. ストラテジーのパラメーター
次の項目が指定できます。
3-1. 期間の設定
Staer date : バックテストの検証期間の開始日を指定します
Stop date : バックテストの検証期間の終了日を指定します
3-2. トレンドとシグナルの表示
Show trend : チェックを入れると、バーの背景色が、トレンドが上昇のときは薄い赤で、下落のときは薄い青で表示されます
Show signal : チェックを入れると、エントリーと手仕舞いのシグナルを表示します(シグナルの出た翌日の寄り付きに売買をするので表示に1日のずれがあります)
3-3. 資金管理用の設定
Funds : トレード用の資金(円)
Risk rate : 許容損失を資金の何%にするかで指定します
「プロパティタブ」で設定する値は、このストラテジーでは有効ではありません。
4. バックテストの結果(例)
作者がバックテストを実施した結果をお知らせします。
対象銘柄:日経225構成銘柄すべて
対象期間:2000年1月4日~2024年12月30日
データ件数:12,886
勝率:33.45%
純利益:82,132,380
ペイオフレシオ:2.450
期待値:6,373.8
リスク資金比率:1.0%
破産確率:0.00%

MACD Volume Strategy (BBO + MACD State, Reversal Type)Overview
MACD Volume Strategy (BBO + MACD State, Reversal Type) is a momentum-based reversal system that combines MACD crossover logic with volume filtering to enhance signal accuracy and minimize noise. It aims to identify structural trend shifts and manage risk using predefined parameters.
※This strategy is for educational and research purposes only. All results are based on historical simulations and do not guarantee future performance.
Strategy Objectives
Identify early trend transitions with high probability
Filter entries using volume dynamics to validate momentum
Maintain continuous exposure using a reversal-style model
Apply a consistent 1:1.5 risk-to-reward ratio per trade
Key Features
Integrated MACD and volume oscillator filtering
Zero repainting (all signals confirmed on closed candles)
Automatic position flipping for seamless direction shifts
Stop-loss and take-profit based on recent structural highs/lows
Trading Rules
Long Entry Conditions
MACD crosses above the zero line (BBO Buy arrow)
Volume oscillator is positive (short EMA > long EMA)
MACD is above the signal line
Close any existing short and enter a new long
Short Entry Conditions
MACD crosses below the zero line (BBO Sell arrow)
Volume oscillator is positive
MACD is below the signal line
Close any existing long and enter a new short
Exit Rules
Take Profit (TP) = Entry ± (risk distance × 1.5)
Stop Loss (SL) = Recent swing low (for long) or high (for short)
Early Exit = Triggered when a reversal signal appears (flip logic)
Risk Management Parameters
Pair: ETH/USD
Timeframe: 10-minute
Starting Capital: $3,000
Commission: 0.02%
Slippage: 2 pip
Risk per Trade: 5% of account equity (adjusted for sustainable practice)
Total Trades: 312 (backtest on selected dataset)
※Risk parameters are fully configurable and should be adjusted to suit each trader's personal setup and broker conditions.
Parameters & Configurations
Volume Short Length: 6
Volume Long Length: 12
MACD Fast Length: 11
MACD Slow Length: 21
Signal Smoothing: 10
Oscillator MA Type: SMA
Signal Line MA Type: SMA
Visual Support
Green arrow = Long entry
Red arrow = Short entry
MACD lines, signal line, and histogram
SL/TP markers plotted directly on the chart
Strategic Advantages & Uniqueness
Volume filtering eliminates low-participation, weak signals
Structurally aligned SL/TP based on recent market pivots
No repainting — decisions are made only on closed candles
Always in the market due to the reversal-style framework
Inspirations & Attribution
This strategy is inspired by the excellent work of:
Bitcoinblockchainonline – “BBO_Roxana_Signals MACD + vol”
Leveraging MACD zero-line cross and volume oscillator for intuitive signal generation.
HasanRifat – “MACD Fake Filter ”
Introduced a signal filter using MACD wave height averaging to reduce false positives.
This strategy builds upon those ideas to create a more automated, risk-aware, and technically adaptive system.
Summary
MACD Volume Strategy is a clean, logic-first automated trading system built for precision-seeking traders. It avoids discretionary bias and provides consistent signal logic under backtested historical conditions.
100% mechanical — no discretionary input required
Designed for high-confidence entries
Can be extended with filters, alerts, or trailing stops
※Strategy performance depends on market context. Past performance is not indicative of future results. Use with proper risk management and careful configuration.

Multi-Fibonacci Trend Average[FibonacciFlux]Multi-Fibonacci Trend Average (MFTA): An Institutional-Grade Trend Confluence Indicator for Discerning Market Participants
My original indicator/Strategy:
Engineered for the sophisticated demands of institutional and advanced traders, the Multi-Fibonacci Trend Average (MFTA) indicator represents a paradigm shift in technical analysis. This meticulously crafted tool is designed to furnish high-definition trend signals within the complexities of modern financial markets. Anchored in the rigorous principles of Fibonacci ratios and augmented by advanced averaging methodologies, MFTA delivers a granular perspective on trend dynamics. Its integration of Multi-Timeframe (MTF) filters provides unparalleled signal robustness, empowering strategic decision-making with a heightened degree of confidence.
MFTA indicator on BTCUSDT 15min chart with 1min RSI and MACD filters enabled. Note the refined signal generation with reduced noise.
MFTA indicator on BTCUSDT 15min chart without MTF filters. While capturing more potential trading opportunities, it also generates a higher frequency of signals, including potential false positives.
Core Innovation: Proprietary Fibonacci-Enhanced Supertrend Averaging Engine
The MFTA indicator’s core innovation lies in its proprietary implementation of Supertrend analysis, strategically fortified by Fibonacci ratios to construct a truly dynamic volatility envelope. Departing from conventional Supertrend methodologies, MFTA autonomously computes not one, but three distinct Supertrend lines. Each of these lines is uniquely parameterized by a specific Fibonacci factor: 0.618 (Weak), 1.618 (Medium/Golden Ratio), and 2.618 (Strong/Extended Fibonacci).
// Fibonacci-based factors for multiple Supertrend calculations
factor1 = input.float(0.618, 'Factor 1 (Weak/Fibonacci)', minval=0.01, step=0.01, tooltip='Factor 1 (Weak/Fibonacci)', group="Fibonacci Supertrend")
factor2 = input.float(1.618, 'Factor 2 (Medium/Golden Ratio)', minval=0.01, step=0.01, tooltip='Factor 2 (Medium/Golden Ratio)', group="Fibonacci Supertrend")
factor3 = input.float(2.618, 'Factor 3 (Strong/Extended Fib)', minval=0.01, step=0.01, tooltip='Factor 3 (Strong/Extended Fib)', group="Fibonacci Supertrend")
This multi-faceted architecture adeptly captures a spectrum of market volatility sensitivities, ensuring a comprehensive assessment of prevailing conditions. Subsequently, the indicator algorithmically synthesizes these disparate Supertrend lines through arithmetic averaging. To achieve optimal signal fidelity and mitigate inherent market noise, this composite average is further refined utilizing an Exponential Moving Average (EMA).
// Calculate average of the three supertends and a smoothed version
superlength = input.int(21, 'Smoothing Length', tooltip='Smoothing Length for Average Supertrend', group="Fibonacci Supertrend")
average_trend = (supertrend1 + supertrend2 + supertrend3) / 3
smoothed_trend = ta.ema(average_trend, superlength)
The resultant ‘Smoothed Trend’ line emerges as a remarkably responsive yet stable trend demarcation, offering demonstrably superior clarity and precision compared to singular Supertrend implementations, particularly within the turbulent dynamics of high-volatility markets.
Elevated Signal Confluence: Integrated Multi-Timeframe (MTF) Validation Suite
MFTA transcends the limitations of conventional trend indicators by incorporating an advanced suite of three independent MTF filters: RSI, MACD, and Volume. These filters function as sophisticated validation protocols, rigorously ensuring that only signals exhibiting a confluence of high-probability factors are brought to the forefront.
1. Granular Lower Timeframe RSI Momentum Filter
The Relative Strength Index (RSI) filter, computed from a user-defined lower timeframe, furnishes critical momentum-based signal validation. By meticulously monitoring RSI dynamics on an accelerated timeframe, traders gain the capacity to evaluate underlying momentum strength with precision, prior to committing to signal execution on the primary chart timeframe.
// --- Lower Timeframe RSI Filter ---
ltf_rsi_filter_enable = input.bool(false, title="Enable RSI Filter", group="MTF Filters", tooltip="Use RSI from lower timeframe as a filter")
ltf_rsi_timeframe = input.timeframe("1", title="RSI Timeframe", group="MTF Filters", tooltip="Timeframe for RSI calculation")
ltf_rsi_length = input.int(14, title="RSI Length", minval=1, group="MTF Filters", tooltip="Length for RSI calculation")
ltf_rsi_threshold = input.int(30, title="RSI Threshold", minval=0, maxval=100, group="MTF Filters", tooltip="RSI value threshold for filtering signals")
2. Convergent Lower Timeframe MACD Trend-Momentum Filter
The Moving Average Convergence Divergence (MACD) filter, also calculated on a lower timeframe basis, introduces a critical layer of trend-momentum convergence confirmation. The bullish signal configuration rigorously mandates that the MACD line be definitively positioned above the Signal line on the designated lower timeframe. This stringent condition ensures a robust indication of converging momentum that aligns synergistically with the prevailing trend identified on the primary timeframe.
// --- Lower Timeframe MACD Filter ---
ltf_macd_filter_enable = input.bool(false, title="Enable MACD Filter", group="MTF Filters", tooltip="Use MACD from lower timeframe as a filter")
ltf_macd_timeframe = input.timeframe("1", title="MACD Timeframe", group="MTF Filters", tooltip="Timeframe for MACD calculation")
ltf_macd_fast_length = input.int(12, title="MACD Fast Length", minval=1, group="MTF Filters", tooltip="Fast EMA length for MACD")
ltf_macd_slow_length = input.int(26, title="MACD Slow Length", minval=1, group="MTF Filters", tooltip="Slow EMA length for MACD")
ltf_macd_signal_length = input.int(9, title="MACD Signal Length", minval=1, group="MTF Filters", tooltip="Signal SMA length for MACD")
3. Definitive Volume Confirmation Filter
The Volume Filter functions as an indispensable arbiter of trade conviction. By establishing a dynamic volume threshold, defined as a percentage relative to the average volume over a user-specified lookback period, traders can effectively ensure that all generated signals are rigorously validated by demonstrably increased trading activity. This pivotal validation step signifies robust market participation, substantially diminishing the potential for spurious or false breakout signals.
// --- Volume Filter ---
volume_filter_enable = input.bool(false, title="Enable Volume Filter", group="MTF Filters", tooltip="Use volume level as a filter")
volume_threshold_percent = input.int(title="Volume Threshold (%)", defval=150, minval=100, group="MTF Filters", tooltip="Minimum volume percentage compared to average volume to allow signal (100% = average)")
These meticulously engineered filters operate in synergistic confluence, requiring all enabled filters to definitively satisfy their pre-defined conditions before a Buy or Sell signal is generated. This stringent multi-layered validation process drastically minimizes the incidence of false positive signals, thereby significantly enhancing entry precision and overall signal reliability.
Intuitive Visual Architecture & Actionable Intelligence
MFTA provides a demonstrably intuitive and visually rich charting environment, meticulously delineating trend direction and momentum through precisely color-coded plots:
Average Supertrend: Thin line, green/red for uptrend/downtrend, immediate directional bias.
Smoothed Supertrend: Bold line, teal/purple for uptrend/downtrend, cleaner, institutionally robust trend.
Dynamic Trend Fill: Green/red fill between Supertrends quantifies trend strength and momentum.
Adaptive Background Coloring: Light green/red background mirrors Smoothed Supertrend direction, holistic trend perspective.
Precision Buy/Sell Signals: ‘BUY’/‘SELL’ labels appear on chart when trend touch and MTF filter confluence are satisfied, facilitating high-conviction trade action.
MFTA indicator applied to BTCUSDT 4-hour chart, showcasing its effectiveness on higher timeframes. The Smoothed Length parameter is increased to 200 for enhanced smoothness on this timeframe, coupled with 1min RSI and Volume filters for signal refinement. This illustrates the indicator's adaptability across different timeframes and market conditions.
Strategic Applications for Institutional Mandates
MFTA’s sophisticated design provides distinct advantages for advanced trading operations and institutional investment mandates. Key strategic applications include:
High-Probability Trend Identification: Fibonacci-averaged Supertrend with MTF filters robustly identifies high-probability trend continuations and reversals, enhancing alpha generation.
Precision Entry/Exit Signals: Volume and momentum-filtered signals enable institutional-grade precision for optimized risk-adjusted returns.
Algorithmic Trading Integration: Clear signal logic facilitates seamless integration into automated trading systems for scalable strategy deployment.
Multi-Asset/Timeframe Versatility: Adaptable parameters ensure applicability across diverse asset classes and timeframes, catering to varied trading mandates.
Enhanced Risk Management: Superior signal fidelity from MTF filters inherently reduces false signals, supporting robust risk management protocols.
Granular Customization and Parameterized Control
MFTA offers unparalleled customization, empowering users to fine-tune parameters for precise alignment with specific trading styles and market conditions. Key adjustable parameters include:
Fibonacci Factors: Adjust Supertrend sensitivity to volatility regimes.
ATR Length: Control volatility responsiveness in Supertrend calculations.
Smoothing Length: Refine Smoothed Trend line responsiveness and noise reduction.
MTF Filter Parameters: Independently configure timeframes, lookback periods, and thresholds for RSI, MACD, and Volume filters for optimal signal filtering.
Disclaimer
MFTA is meticulously engineered for high-quality trend signals; however, no indicator guarantees profit. Market conditions are unpredictable, and trading involves substantial risk. Rigorous backtesting and forward testing across diverse datasets, alongside a comprehensive understanding of the indicator's logic, are essential before live deployment. Past performance is not indicative of future results. MFTA is for informational and analytical purposes only and is not financial or investment advice.

JsonAlertJsonAlert Library – Convert TradingView Alerts to JSON for Server Processing! 📡
🚀 The JsonAlert library makes it easy to send TradingView alerts as structured JSON to your server, allowing seamless integration with automated trading systems, databases, or webhook-based services.
📌 Features:
✅ Converts TradingView alert data into JSON format
✅ Supports custom key-value pairs for flexibility
✅ Allows frequency control (once per bar, once per bar close, every update)
✅ Easy to integrate with server-side PHP or other languages
Note that you have to pass one string array for keys and one string array for values , also you should pass alert frequency .
📖 Example Usage in Pine Script:
//@version=6
indicator("My script" , overlay = true)
import Penhan/JsonAlert/1 as alrt
if high > low
var array keys = array.from("ticker", "timeframe", "pattern")
var array values = array.from( syminfo.ticker , timeframe.period , str.tostring(123.45) )
alrt.alarm (keys, values , alert.freq_once_per_bar)
📡 Json Output Example:
{"ticker": "BTCUSDT","timeframe": "1","pattern": "123.45"}
🖥️ Server-Side PHP Example:
There you can integrate JsonAlert with your server in seconds! :)

Keltner Channel StrategyOverview
The Keltner Channel Strategy is a powerful trend-following and mean-reversion system that leverages the Keltner Channels, EMA crossovers, and ATR-based stop-losses to optimize trade entries and exits. This strategy has proven to be highly effective, particularly when applied to Gold (XAUUSD) and other commodities with strong trend characteristics.
📈 How It Works
This strategy incorporates two trading approaches: 1️⃣ Keltner Channel Reversal Trades – Identifies overbought and oversold conditions when price touches the outer bands.
2️⃣ Trend Following Trades – Uses the 9 EMA & 21 EMA crossover, with confirmation from the 50 EMA, to enter trades in the direction of the trend.
🔍 Entry & Exit Criteria
📊 Keltner Channel Entries (Reversal Strategy)
✅ Long Entry: When the price crosses below the lower Keltner Band (potential reversal).
✅ Short Entry: When the price crosses above the upper Keltner Band (potential reversal).
⏳ Exit Conditions:
Long positions close when price crosses back above the mid-band (EMA-based).
Short positions close when price crosses back below the mid-band (EMA-based).
📈 Trend Following Entries (Momentum Strategy)
✅ Long Entry: When the 9 EMA crosses above the 21 EMA, and price is above the 50 EMA (bullish momentum).
✅ Short Entry: When the 9 EMA crosses below the 21 EMA, and price is below the 50 EMA (bearish momentum).
⏳ Exit Conditions:
Long positions close when the 9 EMA crosses back below the 21 EMA.
Short positions close when the 9 EMA crosses back above the 21 EMA.
📌 Risk Management & Profit Targeting
ATR-based Stop-Losses:
Long trades: Stop set at 1.5x ATR below entry price.
Short trades: Stop set at 1.5x ATR above entry price.
Take-Profit Levels:
Long trades: Profit target 2x ATR above entry price.
Short trades: Profit target 2x ATR below entry price.
🚀 Why Use This Strategy?
✅ Works exceptionally well on Gold (XAUUSD) due to high volatility.
✅ Combines reversal & trend strategies for improved adaptability.
✅ Uses ATR-based risk management for dynamic position sizing.
✅ Fully automated alerts for trade entries and exits.
🔔 Alerts
This script includes automated TradingView alerts for:
🔹 Keltner Band touches (Reversal signals).
🔹 EMA crossovers (Momentum trades).
🔹 Stop-loss & Take-profit activations.
📊 Ideal Markets & Timeframes
Best for: Gold (XAUUSD), NASDAQ (NQ), Crude Oil (CL), and trending assets.
Recommended Timeframes: 15m, 1H, 4H, Daily.
⚡️ How to Use
1️⃣ Add this script to your TradingView chart.
2️⃣ Select a 15m, 1H, or 4H timeframe for optimal results.
3️⃣ Enable alerts to receive trade notifications in real time.
4️⃣ Backtest and tweak ATR settings to fit your trading style.
🚀 Optimize your Gold trading with this Keltner Channel Strategy! Let me know how it performs for you. 💰📊

Market Structure Break with Volume & ATR#### Indicator Overview:
The *Market Structure Break with Volume & ATR (MSB+VolATR)* indicator is designed to identify significant market structure breakouts and breakdowns using a combination of price action, volume analysis, and volatility (ATR). It is particularly useful for traders who rely on higher timeframes for swing trading or positional trading. The indicator highlights bullish and bearish breakouts, retests, fakeouts, and potential buy/sell signals based on RSI overbought/oversold conditions.
---
### Key Features:
1. *Market Structure Analysis*:
- Identifies swing highs and lows on a user-defined higher timeframe.
- Detects breakouts and breakdowns when price exceeds these levels with volume and ATR validation.
2. *Volume Validation*:
- Ensures breakouts are accompanied by above-average volume, reducing the likelihood of false signals.
3. *ATR Filter*:
- Filters out insignificant breakouts by requiring the breakout size to exceed a multiple of the ATR.
4. *RSI Integration*:
- Adds a momentum filter by considering overbought/oversold conditions using RSI.
5. *Visual Enhancements*:
- Draws colored boxes to highlight breakout zones.
- Labels breakouts, retests, and fakeouts for easy interpretation.
- Displays stop levels for potential trades.
6. *Alerts*:
- Provides alert conditions for buy and sell signals, enabling real-time notifications.
---
### Input Settings and Their Effects:
1. **Timeframe (tf):
- Determines the higher timeframe for market structure analysis.
- *Effect*: A higher timeframe (e.g., 1D) reduces noise and provides more reliable swing points, while a lower timeframe (e.g., 4H) may generate more frequent but less reliable signals.
2. **Lookback Period (length):
- Defines the number of historical bars used to identify significant highs and lows.
- *Effect*: A longer lookback period (e.g., 50) captures broader market structure, while a shorter period (e.g., 20) reacts faster to recent price action.
3. **ATR Length (atr_length):
- Sets the period for ATR calculation.
- *Effect*: A shorter ATR length (e.g., 14) reacts faster to recent volatility, while a longer length (e.g., 21) smooths out volatility spikes.
4. **ATR Multiplier (atr_multiplier):
- Filters insignificant breakouts by requiring the breakout size to exceed ATR × multiplier.
- *Effect*: A higher multiplier (e.g., 0.2) reduces false signals but may miss smaller breakouts.
5. **Volume Multiplier (volume_multiplier):
- Sets the volume threshold for breakout validation.
- *Effect*: A higher multiplier (e.g., 1.0) ensures stronger volume confirmation but may reduce the number of signals.
6. **RSI Length (rsi_length):
- Defines the period for RSI calculation.
- *Effect*: A shorter RSI length (e.g., 10) makes the indicator more sensitive to recent price changes, while a longer length (e.g., 20) smooths out RSI fluctuations.
7. *RSI Overbought/Oversold Levels*:
- Sets the thresholds for overbought (default: 70) and oversold (default: 30) conditions.
- *Effect*: Adjusting these levels can make the indicator more or less conservative in generating signals.
8. **Stop Loss Multiplier (SL_Multiplier):
- Determines the distance of the stop-loss level from the entry price based on ATR.
- *Effect*: A higher multiplier (e.g., 2.0) provides wider stops, reducing the risk of being stopped out prematurely but increasing potential losses.
---
### How It Works:
1. *Breakout Detection*:
- A bullish breakout occurs when the close exceeds the highest high of the lookback period, with volume above the threshold and breakout size exceeding ATR × multiplier.
- A bearish breakout occurs when the close falls below the lowest low of the lookback period, with similar volume and ATR validation.
2. *Retest Logic*:
- After a breakout, if price retests the breakout zone without closing beyond it, a retest label is displayed.
3. *Fakeout Detection*:
- If price briefly breaks out but reverses back into the range, a fakeout label is displayed.
4. *Buy/Sell Signals*:
- A sell signal is generated when price reverses below a bullish breakout zone and RSI is overbought.
- A buy signal is generated when price reverses above a bearish breakout zone and RSI is oversold.
5. *Stop Levels*:
- Stop-loss levels are plotted based on ATR × SL_Multiplier, providing a visual guide for risk management.
---
### Who Can Use It and How:
1. *Swing Traders*:
- Use the indicator on daily or 4-hour timeframes to identify high-probability breakout trades.
- Combine with other technical analysis tools (e.g., trendlines, Fibonacci levels) for confirmation.
2. *Positional Traders*:
- Apply the indicator on weekly or daily charts to capture long-term trends.
- Use the stop-loss levels to manage risk over extended periods.
3. *Algorithmic Traders*:
- Integrate the buy/sell signals into automated trading systems.
- Use the alert conditions to trigger trades programmatically.
4. *Risk-Averse Traders*:
- Adjust the ATR and volume multipliers to filter out low-probability trades.
- Use wider stop-loss levels to avoid premature exits.
---
### Where to Use It:
- *Forex*: Identify breakouts in major currency pairs.
- *Stocks*: Spot trend reversals in high-volume stocks.
- *Commodities*: Trade breakouts in gold, oil, or other commodities.
- *Crypto*: Apply to Bitcoin, Ethereum, or other cryptocurrencies for volatile breakout opportunities.
---
### Example Use Case:
- *Timeframe*: 1D
- *Lookback Period*: 50
- *ATR Length*: 14
- *ATR Multiplier*: 0.1
- *Volume Multiplier*: 0.5
- *RSI Length*: 14
- *RSI Overbought/Oversold*: 70/30
- *SL Multiplier*: 1.5
In this setup, the indicator will:
1. Identify significant swing highs and lows on the daily chart.
2. Validate breakouts with volume and ATR filters.
3. Generate buy/sell signals when price reverses and RSI confirms overbought/oversold conditions.
4. Plot stop-loss levels for risk management.
---
### Conclusion:
The *MSB+VolATR* indicator is a versatile tool for traders seeking to capitalize on market structure breakouts with added confirmation from volume and volatility. By customizing the input settings, traders can adapt the indicator to their preferred trading style and risk tolerance. Whether you're a swing trader, positional trader, or algorithmic trader, this indicator provides actionable insights to enhance your trading strategy.
